- English
- Español
- Français
- Português
- Русский
- العربيه
- فارسی
Beginner's Guide to Basic Technical Patterns


GUIDE TO BASIC TECHNICAL ANALYSIS PATTERNS FOR BEGINNERS
Why Study Basic Technical Patterns?
Technical market analysis combines the use of indicators and price movement analysis. For example, candlestick analysis will show you price changes on the chart.
The basic technical patterns have gained wide popularity in the cryptocurrency market due to their reliability and connection to crowd psychology.
What Are Technical Analysis Patterns?
These are trading patterns that tend to repeat. Thanks to them, traders or investors can predict future price movements.
All technical analysis patterns have solid foundations and years of trader experience.
RECOMMENDATION: technical analysis patterns should be confirmed by trend lines, support and resistance levels, and indicators.
Types of Technical Analysis Patterns
- Trend Continuation Patterns
- Reversal Formations (Patterns)
- Indecision Patterns, also known as bilateral models
Trend Continuation Patterns
Trend continuation patterns signal the probable continuation of the trend. Also known as consolidation[1] patterns because they appear during pullbacks. Some of these patterns can be reversal, depending on their position on the chart.
Trend continuation patterns include figures like flag, pennant, rectangle and triangle.
Flag Pattern
A flag is a period of consolidation that forms after a sharp price movement either up or down.
For the flag pattern in technical analysis, it is important that the price updates previous lows or highs. When this happens, we can expect the formation of a flag on the chart. If the price does not continue to move up or down after this, the trend is likely over, and looking for a flag is pointless.
RECOMMENDATION: Pay attention to trading volumes. The impulse up usually occurs on high volumes. Conversely, the consolidation phase occurs on decreasing volumes.
A flag consists of three parts:
- Strong trend movement - "flagpole"
- Updating the extremum[2]
- Price correction, forming the actual flag.
Bullish Flag
After a sharp rise in the uptrend, a bullish flag usually forms, often predicting its continuation.
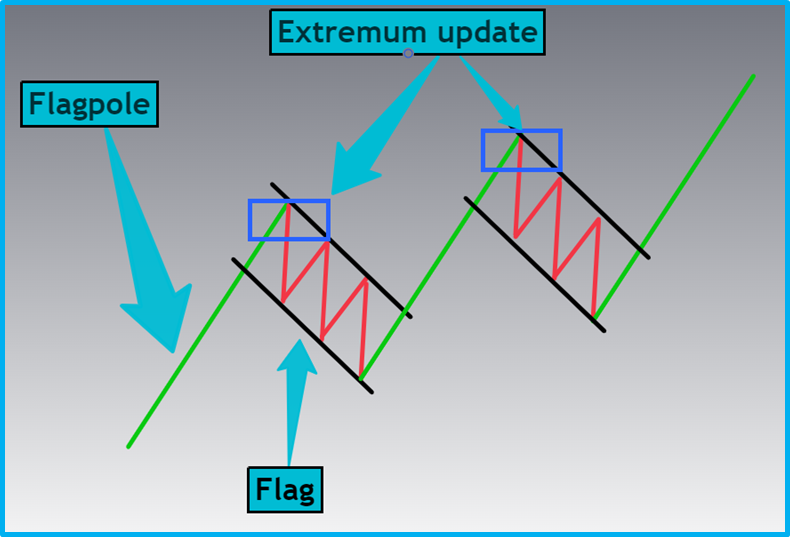
Figure 1 – "Bullish Flag and Its Elements"
Bearish Flag
In a downtrend, after a sharp fall, a bearish flag usually appears, often leading to the continuation of the downtrend.
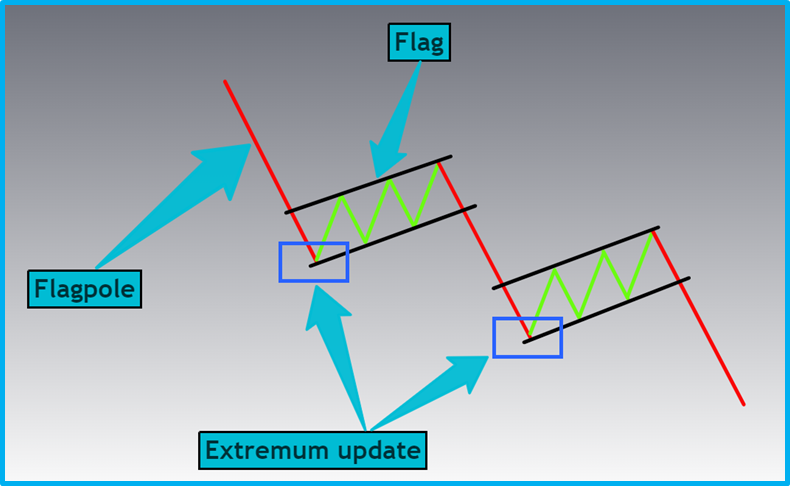
Figure 2 – "Bearish Flag and Its Elements"
Pennant Pattern
A pennant resembles a horizontal triangle, within which price fluctuations decrease.
This pattern leads to a breakout of the upper boundary of the bullish or bearish trend.
!!! NOTE: The pennant can be considered by updating the dips or peaks. The pennant forms after a strong trend impulse.
Pennant in an Uptrend
A pattern indicating the continuation of the bullish trend.
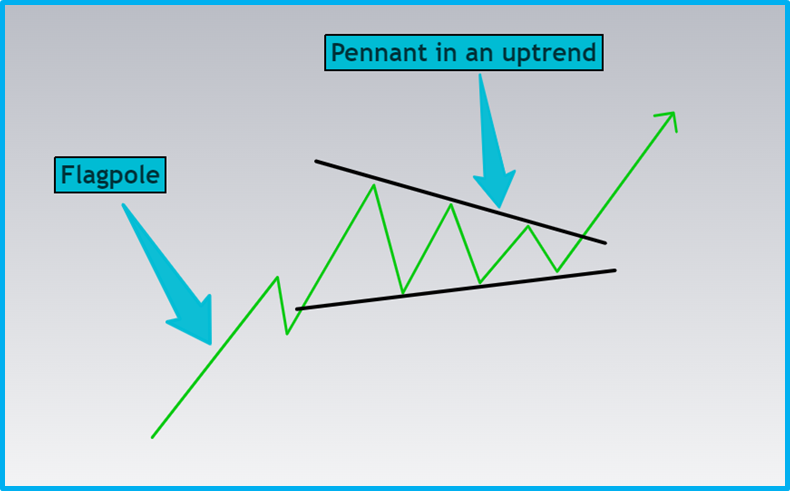
Figure 3 – "Pennant and Its Elements in an Uptrend"
Pennant in a Downtrend
A pattern indicating the continuation of the bearish trend.
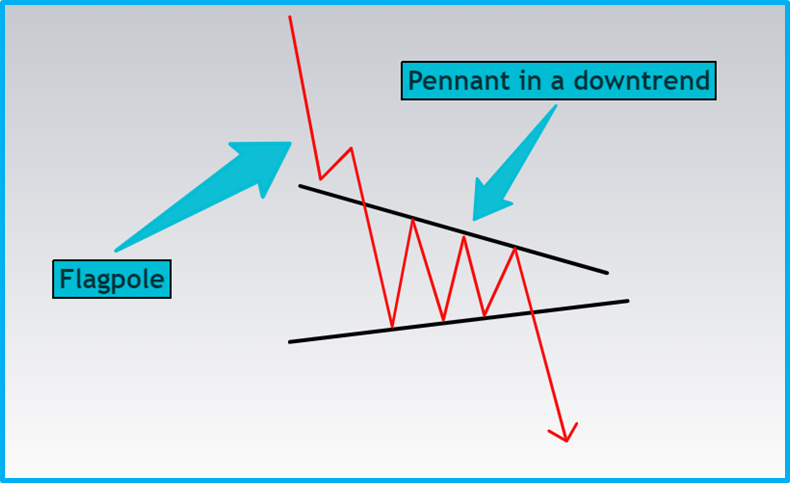
Figure 4 – "Pennant and Its Elements in a Downtrend"
Rectangle Pattern
A rectangle marks a stable area of demand and supply, where the price is temporarily stuck until sufficient market participant forces appear to continue the trend.
If a rectangle (sideways movement) forms on the chart, it signals a temporary pause in the struggle between bulls and bears.
- The upper boundary of the rectangle is resistance (supply in the market)
- The lower boundary of the rectangle is support (demand in the market)
RECOMMENDATION: Pay attention to the trend in which the rectangle forms. This affects the entry points into trades.
Rectangle in an Uptrend
This is a temporary price plateau where the market rests before potentially continuing upward.
Important features:
- Support is a strong area. Consider entry points from it.
- The height of the rectangle is the distance the price may strive for after the breakout.
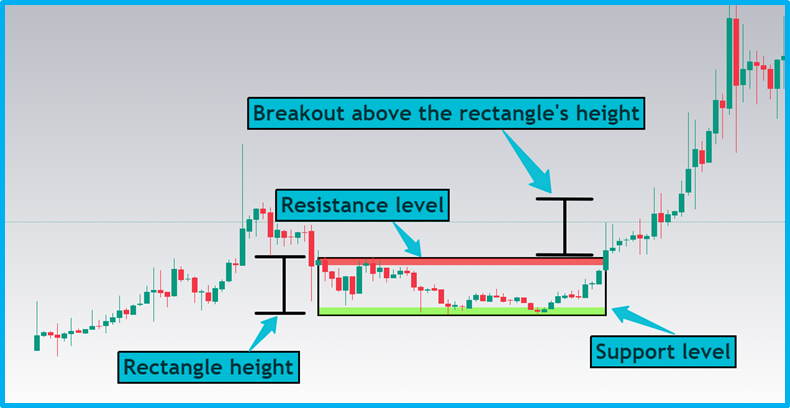
Figure 5 – "Rectangle in an Uptrend and Its Elements"
Rectangle in a Downtrend
This is a situation where prices temporarily stop at one level before falling again.
Important features:
- The resistance area is a strong zone
- The breakout often occurs in the support area
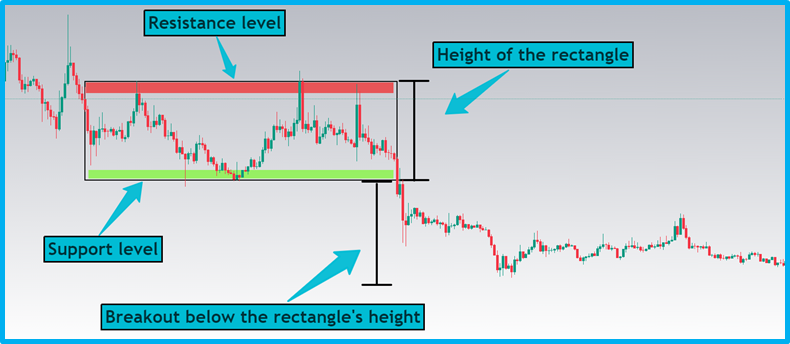
Figure 6 – "Rectangle in a Downtrend and Its Elements"
Triangle Figure
This model where upper and lower lines are formed based on price extremes. These lines can converge or diverge, creating either a contracting or expanding figure.
The important side in the triangle is the one indicating the current trend. When the price breaks this boundary, the trend continues.
It is important to pay attention to:
- Whether a triangle is formed in the trend or not
- The slope of the triangle's edges
!!! NOTE: The height of the triangle determines how much the price can rise or fall after its breakout.
Triangle in an Uptrend
A trend continuation pattern indicating a strong upward movement after the breakout.
Key Features:
- Base height - the minimum distance where the price continues to move
- If the price breaks the trend line, it is likely to continue
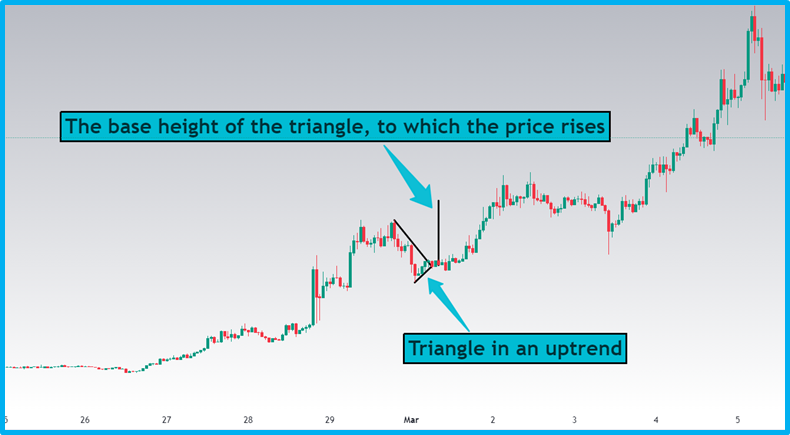
Fig. 7 - "Triangle in an Uptrend and Its Elements"
Triangle in a Downtrend
A trend continuation pattern indicating a strong downward movement after the breakout.
Key Features:
- Base height - the minimum distance where the price continues to move
- If the price breaks the trend line, it is likely to continue
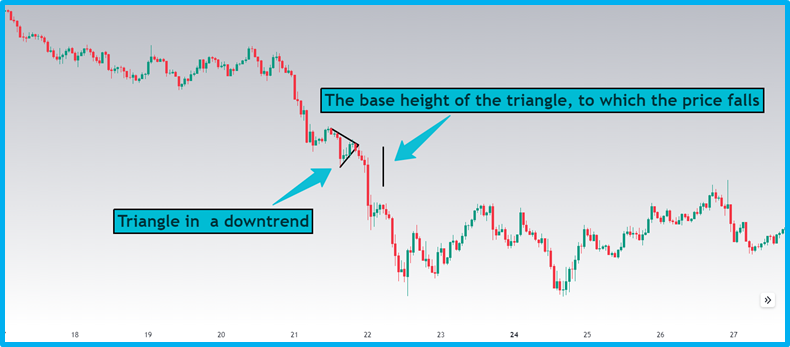
Fig. 8 - "Triangle in a Downtrend and Its Elements"
Reversal Formations (Patterns)
Patterns on a chart indicating a change in trend direction.
Reversal patterns include: double top (M pattern); double bottom (W pattern); head and shoulders; inverse head and shoulders; cup with handle; inverted cup with handle; rising wedge, falling wedge.
Double Top (M Pattern)
A pattern where two points at the top of the chart where prices cannot rise above. This means the trend may change from bullish to bearish. Sometimes there are three peaks, but it's the same idea - the price cannot break the resistance zone.
The double top forms after reaching a price peak. Variations of a double top:
- The first peak is higher than the second - a strong reversal signal.
- Both peaks are at the same level.
- The second peak is slightly higher than the first - a weak reversal signal.
There is a low point between the two peaks - the neckline. The distance from the neckline to the second peak indicates how much the price can fall after the reversal.
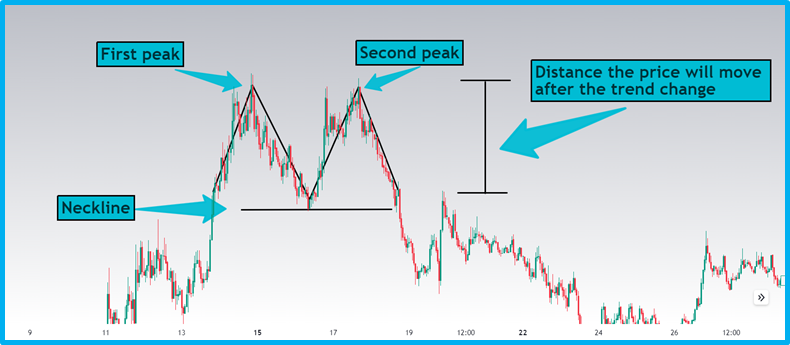
Fig. 9 - "Double Top Pattern"
Double Bottom (W Pattern)
A mirrored pattern of the double top (M pattern). It occurs after the price reaches the same low support level twice (sometimes thrice) and cannot go lower. This pattern signals a possible end to the downtrend and the start of an uptrend.
The double bottom forms after reaching the lowest point in a downtrend. Characteristics:
- It has two nearly identical low points.
- If the second low point is higher than the first, it's a strong signal.
- The distance from the neckline to the second point indicates how much the price can rise after the reversal.
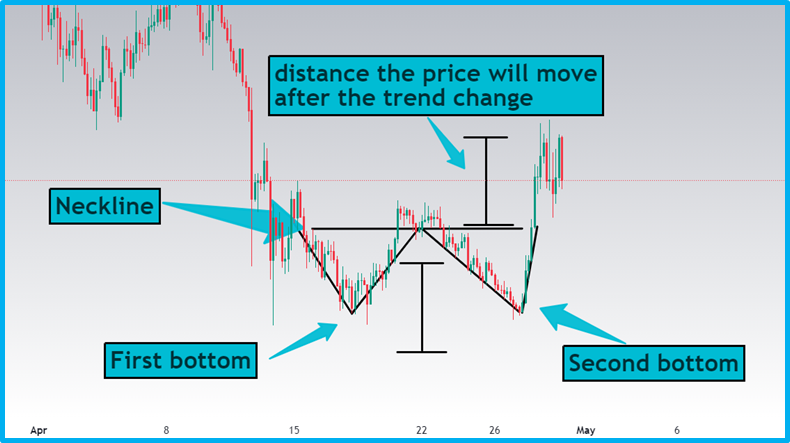
Fig. 10 - "Double Bottom Pattern"
Head and Shoulders
A pattern consisting of three peaks signaling the end of a rise. Such a figure forms at the peaks of a bullish trend.
Characteristics:
- The first peak (left shoulder) appears at a resistance level within normal price increases.
- The second peak (head) is higher than the first, as the price breaks the old resistance level and reaches a new one.
- The third peak (right shoulder) is lower than the second, signaling the end of the uptrend and a possible reversal.
- The height of the Head and Shoulders pattern indicates how much the price can fall after the pattern is fully formed.
All peaks form at support and resistance levels. Often the first and third peaks are symmetrical and at the same level. If the right shoulder is lower than the left, it indicates a strong reversal and predicts a sustained price decrease.
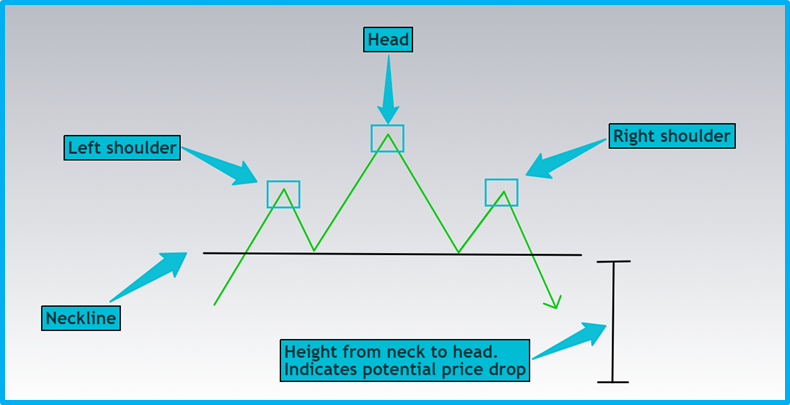
Fig. 11 - "Head and Shoulders Pattern"
Inverse Head and Shoulders
The mirrored version of the regular Head and Shoulders pattern. It appears after a downtrend and signals the beginning of an uptrend.
Characteristics:
- The troughs form at support and resistance levels.
- The first trough (left shoulder) indicates a continuation of the trend.
- The second trough (head) reaches a new minimum.
- The third trough (right shoulder) forms above the second, signaling the end of the downtrend and the beginning of the uptrend.
- The model is considered strong if the right shoulder is higher than the left.
The height of the Inverse Head and Shoulders pattern indicates the distance the price will move upwards after completing the reversal pattern.
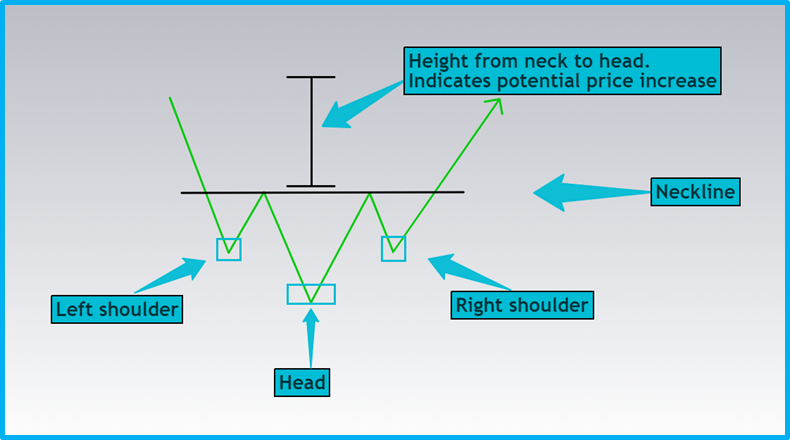
Fig. 12 - "Inverse Head and Shoulders Pattern"
Cup and Handle
This figure shows the transition from a downtrend to an uptrend, forming a cup.
Characteristics:
- The troughs stop updating, and the peaks begin to rise.
- The handle is the first pullback in the new uptrend, confirming the end of the downtrend.
- The upper boundaries of the cup are at support and resistance levels, but only the left boundary is important: its breakout indicates a trend change.
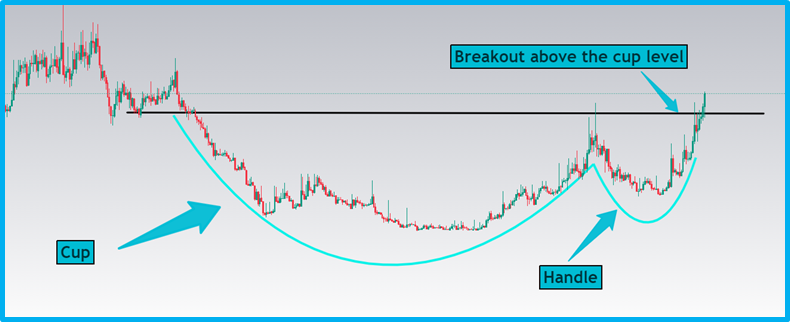
Fig. 13 - "Cup and Handle"
Inverted Cup and Handle
This figure shows the transition from an uptrend to a downtrend, forming an inverted cup. Essentially, it's the mirrored pattern of a cup and handle.
Characteristics:
- The cup indicates the end of the uptrend, and the handle confirms the reversal;
- The edges of the cup are determined by support and resistance levels, but only the left part of the cup and the handle are important.
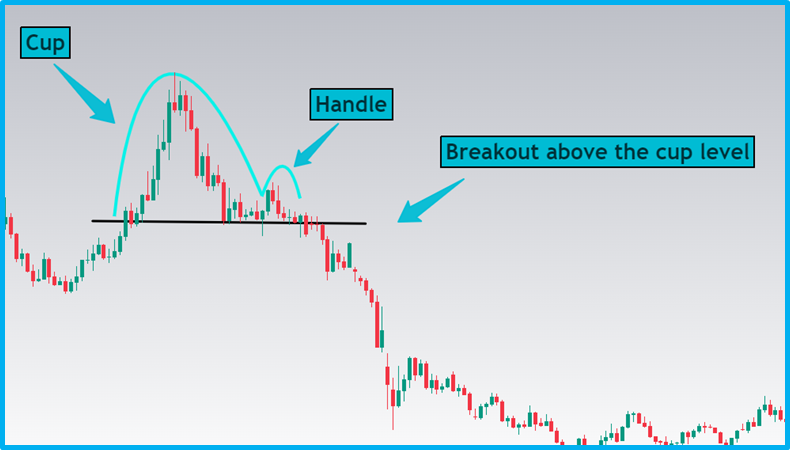
Fig. 14 - "Inverted Cup and Handle"
Rising Wedge
A pattern that forms a narrowing triangle pointing upwards. When the rising wedge appears at the top of a trend, it indicates a possible reversal, and a price decline is expected.
Characteristic: the height of the base - the distance the price can fall.
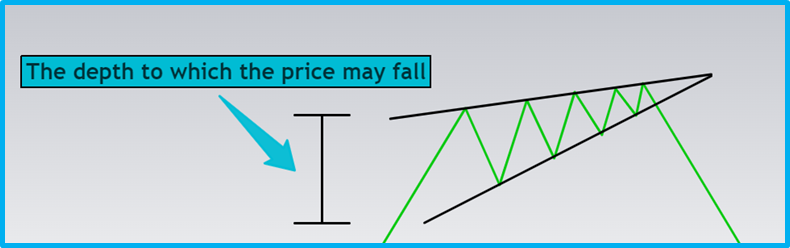
Fig. 15 - "Rising Wedge"
!!! NOTE: the rising wedge pattern also serves as a trend continuation pattern.
If the rising wedge forms during a downtrend, it indicates a temporary pullback, and the probability of further decline remains.
Falling Wedge
A similar pattern to the rising wedge. The falling wedge serves as a reversal signal if formed in a downtrend or indicates a trend continuation if it occurs in an uptrend.
Characteristic: the height of the base - the distance the price can rise.
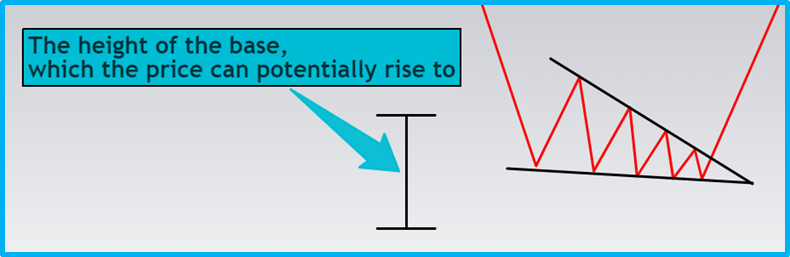
Fig. 16 - "Falling Wedge"
Patterns of Uncertainty, also known as Two-way Models
These are patterns that do not have a clear market direction and can be interpreted as signals for both uptrends and downtrends
Patterns of uncertainty include: symmetrical triangle.
Symmetrical Triangle
Formed as a result of a narrowing trading range. It forms between the descending trend line (line connecting subsequent highs) and the ascending trend line (line connecting subsequent higher lows).
As the trend lines converge, a symmetrical triangle is formed, indicating a balance between bulls and bears. In other words, the market is in an uncertain phase.
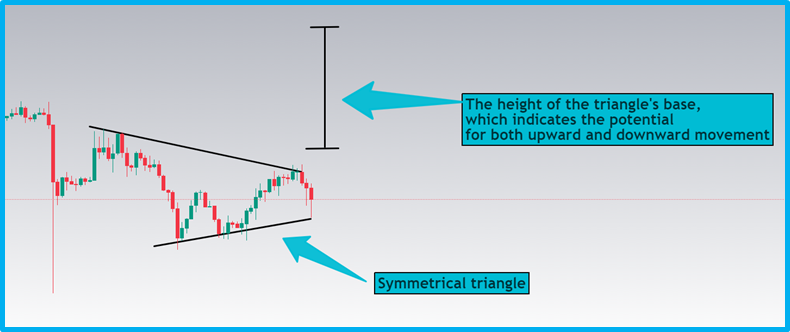
Fig. 17 - "Symmetrical Triangle"
Conclusions
Technical analysis is based on the study of price charts. For an investor or trader, they serve as one of the sources of information, showing past and current trends. The main patterns of technical analysis help interpret asset behavior. At the same time, it's necessary to analyze the market situation as a whole and study trader behavior to confirm your purchases or sales.
!!! NOTE: please, observe risks and money management.
________________________________________________________________________________________
[1] Consolidation - a period when the price of an asset moves within a narrow range, not indicating a clear upward or downward trend.
[2] Extreme - a point on the chart that is either the highest (maximum) or lowest (minimum) for a certain period of time.
