The best indicators for cryptocurrency trading in 2024


with ArbitrageScanner!
BEST INDICATORS FOR CRYPTOCURRENCY TRADING IN 2024
Cryptocurrency trading involves buying and selling digital assets through specialized platforms, whether they are DEX platforms or CEX exchanges. This type of trading differs from traditional markets as it is decentralized and available 24/7, allowing trades to be made at any time.
Undoubtedly, a trading strategy is essential for successful trading. Traders and investors often use specific indicators to analyze the market, identify patterns, and help make informed trading decisions. These tools help traders better understand the market and develop and implement reliable strategies.
Understanding and using the best indicators for cryptocurrency trading is a definite advantage in 2024, as the market has become smarter, and to maximize your profits and results, you should consider using effective indicators.
INDICATORS AND THEIR IMPORTANCE IN CRYPTOCURRENCY TRADING
The use of indicators in cryptocurrency trading plays a crucial role, providing traders with information about market trends and price movements. These tools, based on mathematical calculations and statistical analysis, help identify patterns and potential price changes.
Traders and often investors use indicators to make informed decisions about when to enter and exit trades, which helps reduce risks and increase profits.
In cryptocurrency trading, indicators can be divided into three types:
- Trend Indicators:
Trend indicators help determine the overall market direction and detect trend reversals.
- Momentum Indicators:
Momentum indicators help assess the strength of price movements by evaluating trading activity based on volume.
- Volume Indicators:
Volume indicators evaluate trading activity based on the volume of trades, helping understand the strength of price changes.
These indicators help both to determine the market direction and to measure the strength of price movements and assess trading activity. Combining them allows for more accurate analysis and adaptation to changes in the volatile cryptocurrency market.
Additionally, using indicators in trading strategies helps effectively manage risks and make informed decisions based on objective data, reducing the influence of emotions on decision-making.
RELATIVE STRENGTH INDEX (RSI)
RSI is a popular tool for evaluating price strength in cryptocurrency trading. It measures price momentum by comparing the gains and losses of a cryptocurrency over a specific period.
RSI indicates how overbought or oversold an asset is, with a range of values from 0 to 100, where:
- Values above 70 indicate overbought conditions (a correction may be possible);
- Values below 30 indicate oversold conditions (a bounce may be possible).
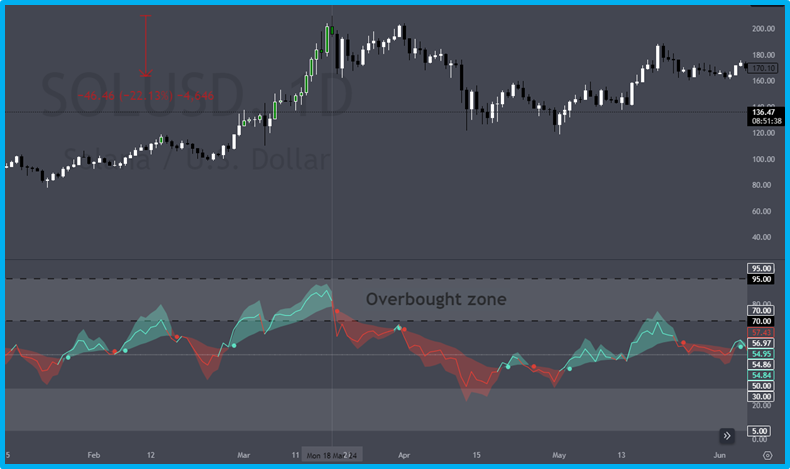
Fig. 1 – "RSI in the overbought zone on the SOL/USD 1D chart, Coinbase exchange"
In Fig. 1, SOL entered the overbought zone according to the RSI, where it corrected by -22%.
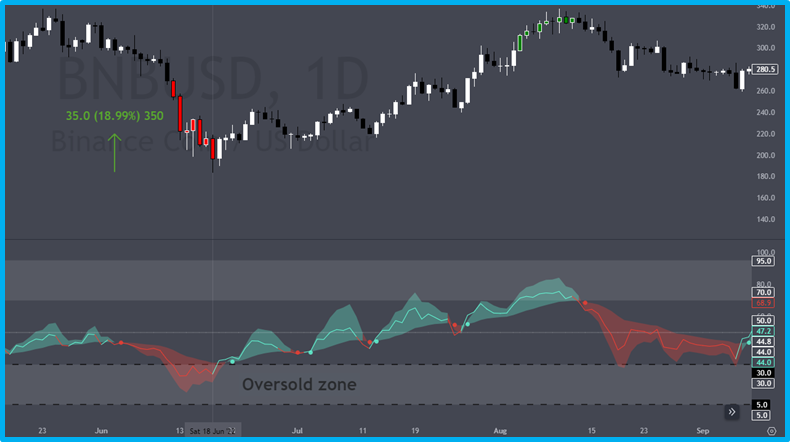
Fig. 2 – "RSI in the oversold zone on the BNB/USD 1D chart, Binance exchange"
In Fig. 2, BNB entered the oversold zone according to the RSI and experienced a buyer reaction, resulting in an increase of +18%.
PROS AND CONS OF THE RSI INDICATOR
Experienced traders and investors appreciate the simplicity of the RSI, which is presented as a line chart, making it possible to see clear signals of overbought or oversold conditions.
However, it can be challenging to use without practice, especially if you are a beginner, as its nuances can be difficult to grasp at first glance.
RECOMMENDATION: Combine RSI with other indicators to enhance the effectiveness and accuracy of your trading strategies. Additionally, review its historical performance on different timeframes to understand how it works.
MOVING AVERAGE CONVERGENCE DIVERGENCE (MACD)
MACD is a trend indicator used by cryptocurrency traders to assess the strength and direction of price movements.
It is calculated by subtracting the 26-day exponential moving average (EMA) from the 12-day EMA, and then plotting a signal line from the 9-day EMA.
MACD shows how quickly prices are changing and the direction of the trend, helping to make informed decisions.
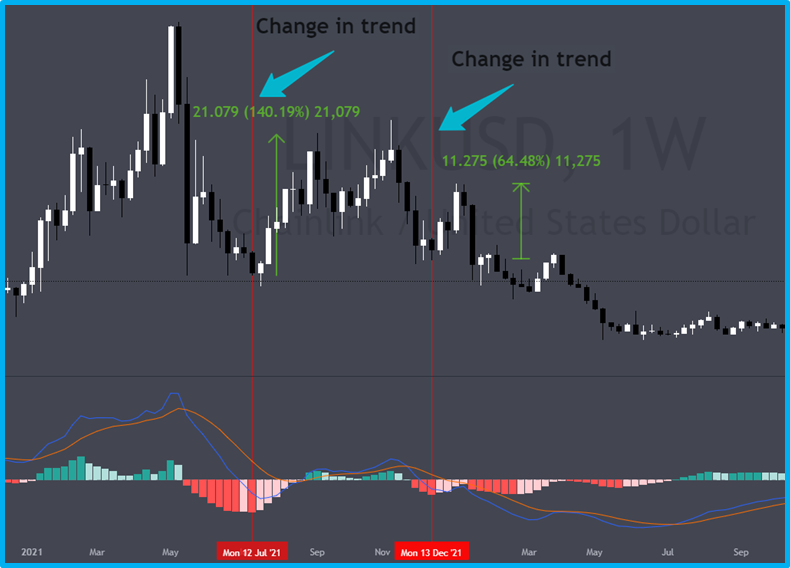
Fig. 3 – "Reversal of the downtrend by MACD on the LINK/USD 1W chart, Coinbase exchange"
Thus, on July 12 and December 13, 2021, according to the MACD, there was a reversal of the downtrend, leading to a 140% rise in LINK in the first case and a 64% rise in LINK in the second.
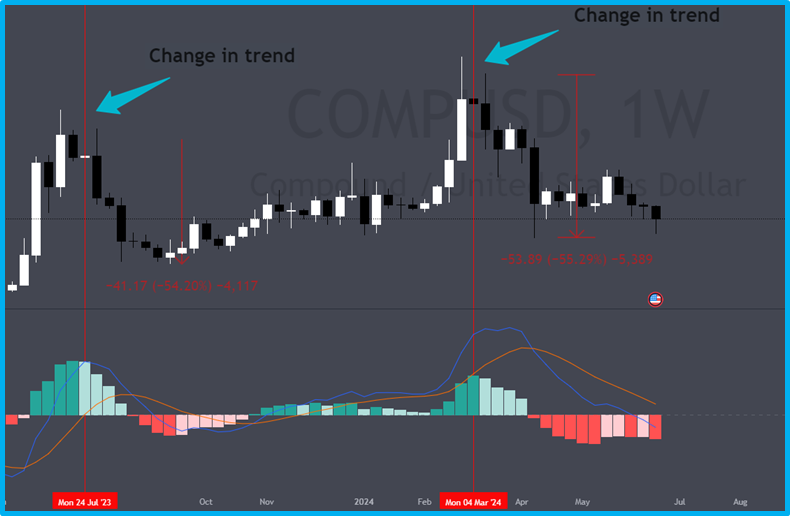
Fig. 4 – "Reversal of the uptrend by MACD on the COMP/USD 1W chart, Coinbase exchange"
On July 24, 2023, the MACD showed a shift in buyer strength, resulting in a -54% correction. Similarly, on March 4, 2024, the MACD indicated a weakening buyer, leading to a -55% correction.
PROS AND CONS OF THE MACD INDICATOR
MACD is a simple and effective tool for identifying trends and trading signals in cryptocurrency trading. It can be adjusted for different timeframes and trading styles.
However, like any indicator, MACD can sometimes give false signals. Therefore, using MACD in isolation from other indicators is not sufficient for making buying or selling decisions.
RECOMMENDATION: Combine the MACD indicator with other metrics to reduce risk and provide additional confirmation for trading decisions.
TREND LINES
Trend lines are simple but very effective tools that help identify market trends. By connecting several highs and lows, they show the market direction and the strength of the trend.
There are two types of trend lines:
- Uptrend Line:
A line that connects two or more lows, each higher than the previous one. An uptrend line indicates increasing demand and an uptrend.
- Downtrend Line:
A line that connects two or more highs, each lower than the previous one. This indicates increasing supply or decreasing demand, signifying a downtrend.
Features of trend lines:
- A trend line that touches more than three points is considered more reliable than one that touches two points;
- If a trend line is maintained without interruptions, it becomes more significant;
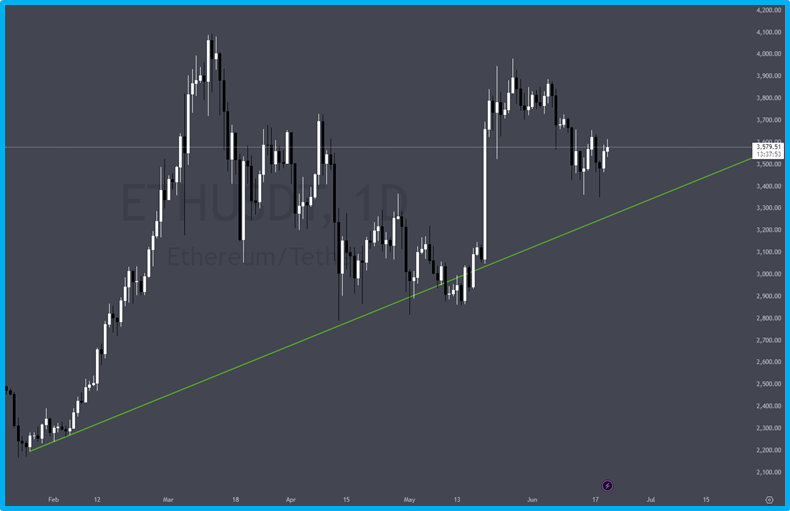
Fig. 5 – "Example of an uptrend line on the ETH/USDT 1D chart, OKX exchange"
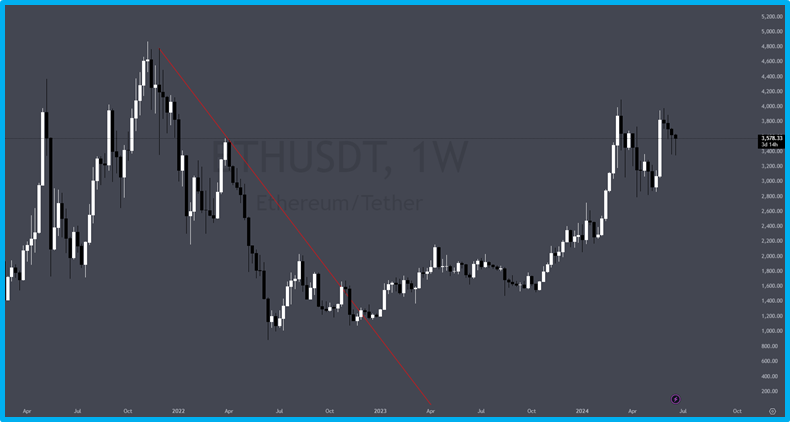
Fig. 6 – "Example of a downtrend line on the ETH/USDT 1W chart, OKX exchange"
PROS AND CONS OF TREND LINES
Trend lines are important for identifying market trends, but they should not be used alone. Combine them with indicators like moving averages, RSI, or MACD for more accurate analysis and to reduce false signals.
Since drawing trend lines is subjective, different traders may interpret the same chart differently, leading to various decisions.
Using trend lines in market analysis helps to better understand trends and make informed decisions. Combining them with other tools allows for more accurate market analysis and greater confidence in navigating complex market situations.
AROON INDICATOR
A technical analysis tool used to determine trend changes and strength.
The Aroon indicator consists of two lines:
- Aroon Up:
measures the time since the highest price.
- Aroon Down:
measures the time since the lowest price.
Aroon values range from 0% to 100%, where:
- Aroon Up value above 50% indicates a strong uptrend;
- Aroon Down value below 50% indicates a strong downtrend.
Aroon helps determine how often prices reach new highs or lows, indicating trend direction.
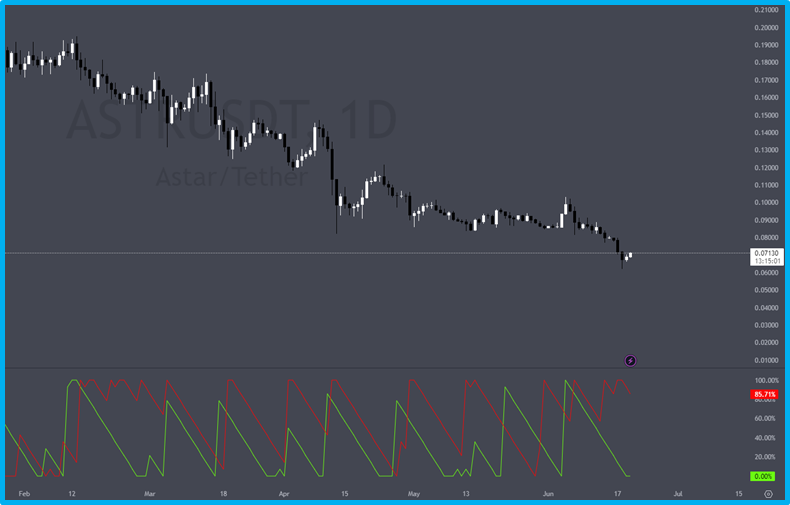
Fig. 7 - Example of Aroon indicator on ASTR/USDT 1D on OKX exchange
In the above figure, we observe that the Aroon Down line (in red) is at 85.71%, indicating a downtrend.
PROS AND CONS OF AROON INDICATOR
The Aroon indicator is easy to use and suitable for different markets and timeframes, making it easy to identify trend changes when lines cross.
However, Aroon provides lagging signals, which can lead to missed opportunities and false signals in volatile markets. It is also less popular and less documented compared to other indicators.
RECOMMENDATION: Aroon indicator should be used in conjunction with other tools like RSI or MACD to confirm signals and reduce the risk of false signals.
FIBONACCI LEVELS
Fibonacci levels are a popular tool among traders and investors to identify potential support and resistance levels in cryptocurrency trading.
They are based on the Fibonacci sequence, where each number is the sum of the two preceding ones.
Levels are calculated by dividing the difference between highs and lows by Fibonacci ratios (23.6%, 38.2%, 50%, 61.8%, and 100%), helping to predict where price might reverse.
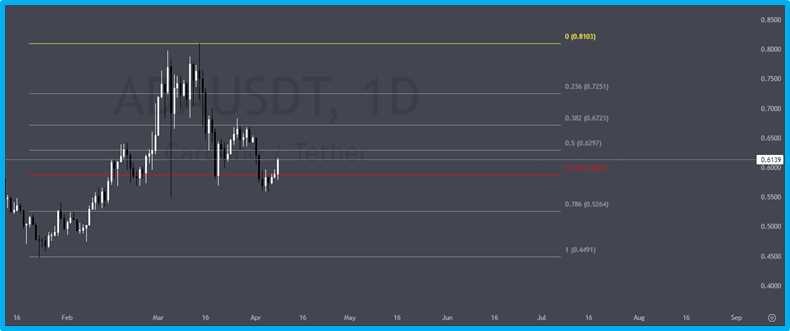
Fig. 8 - Example of Fibonacci retracement on ADA/USDT 1D on Kucoin exchange
PROS AND CONS OF FIBONACCI LEVELS
Fibonacci levels are a simple and effective tool for identifying potential support and resistance levels. They can be adjusted to fit each trader's timeframe and trading style.
However, using Fibonacci levels is subjective, and different traders may choose different ratios and timeframes, leading to conflicting signals.
On the chart, Fibonacci levels are measured from lows at point "1" to highs at point "0". For example, an asset's price may drop to the 0.382 level (38.2%), indicating a potential support level. Other key levels like 0.618 and 0.786 can also be observed, and a channel can be drawn between them, which may hold for several days.
STOCHASTIC OSCILLATOR
The Stochastic Oscillator is a popular technical indicator that helps identify potential trend reversals and overbought or oversold conditions.
It is based on the idea that as an asset's price rises, its closing price tends to approach the upper end of the range, and as it falls, it tends towards the lower end.
By comparing the current closing price with the range over a specified period (usually 14 days), the Stochastic Oscillator indicates whether the asset is trading near its highest or lowest point. This helps decide when to open or close positions.
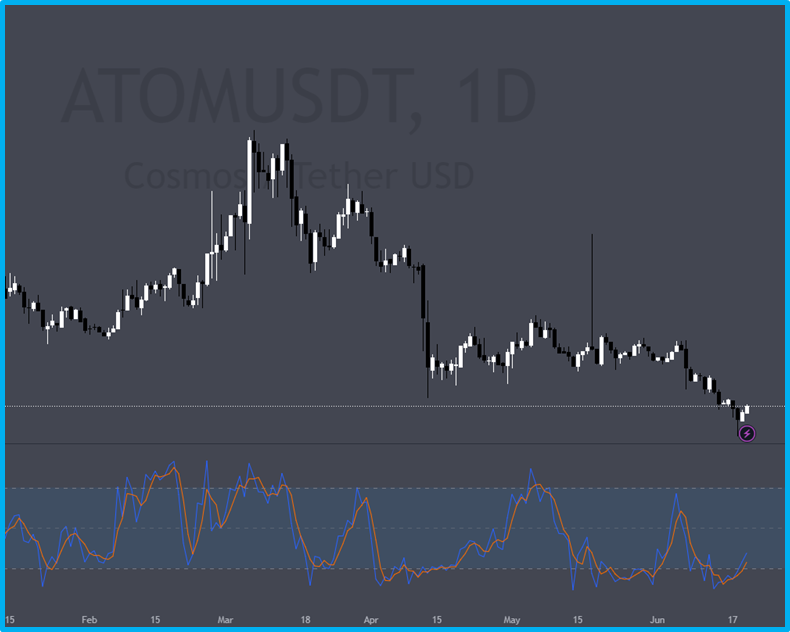
Fig. 9 - Example of Stochastic Oscillator on ATOM/USDT 1D on Kraken exchange
PROS AND CONS OF STOCHASTIC OSCILLATOR
The Stochastic Oscillator provides traders with a simple and effective way to identify potential trend reversals and overbought or oversold conditions in the market. Traders can adjust timeframes and sensitivity levels to suit their trading style.
However, the oscillator can provide conflicting signals during consolidation periods or limited market movements.
ON-BALANCE VOLUME INDICATOR (OBV)
The On-Balance Volume (OBV) measures buying and selling pressure on the market. When the asset's price rises, volume is added to the OBV, and when it falls, volume is subtracted.
The OBV line oscillates around the zero mark, helping to determine the strength and direction of the trend.
This cryptocurrency analysis indicator considers not only trading volume but also price changes, making it more accurate for predicting trends and identifying potential reversals in the market.
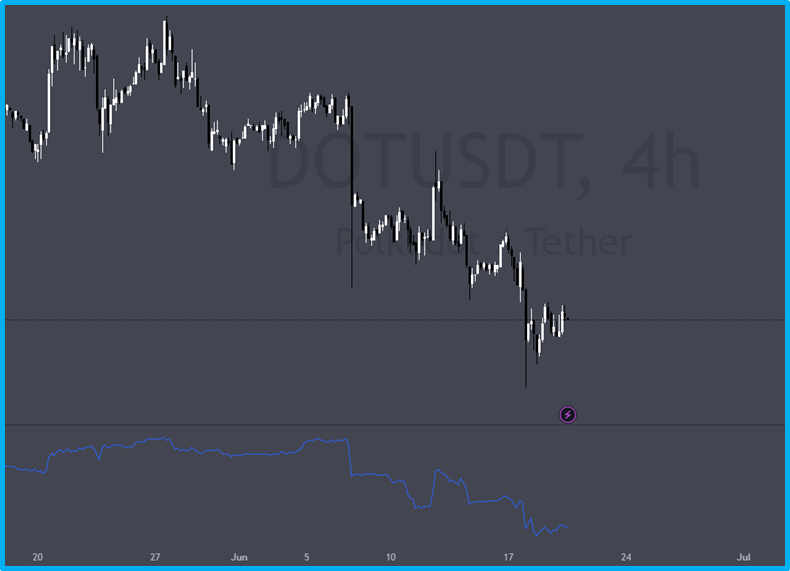
Fig. 10 - Example of OBV indicator on DOT/USD 4H on Coinbase exchange
PROS AND CONS OF OBV INDICATOR
The OBV indicator in cryptocurrency trading helps confirm trends and detect discrepancies between the indicator and asset price. It shows situations where an asset's price moves in one direction while trading volume moves in the opposite direction, which may indicate a trend reversal.
A limitation of OBV is its limited applicability. It is effective in trending market conditions with significant buying or selling pressure.
ICHIMOKU CLOUD
The Ichimoku Cloud, or Ichimoku Kinko Hyo, is a complex technical analysis tool in crypto trading. It combines multiple indicators on a chart to predict trends, support, and resistance levels.
The Ichimoku Cloud consists of:
- Tenkan-sen (Conversion Line):
A short-term indicator used to predict trend reversals.
- Kijun-sen (Base Line):
A long-term indicator that determines the trend direction.
- Senkou Span A and B (Leading Span A and B):
The cloud boundaries that predict future support and resistance levels.
- Chikou Span (Lagging Span):
A line that shows the strength and direction of the trend 26 periods after the current time.
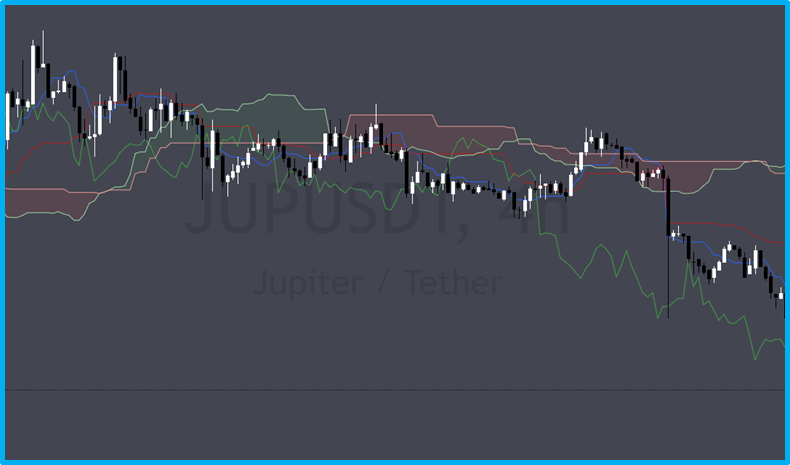
Fig. 11 - Example of Ichimoku Cloud indicator JUP/USDT 4H on Kucoin
PROS AND CONS OF ICHIMOKU CLOUD
The Ichimoku Cloud is useful in cryptocurrency trading, providing traders with a comprehensive view of the market from trend reversals to support and resistance levels. This indicator can be customized to fit a trader's needs by adjusting timeframes and sensitivity.
However, it can appear complex, especially for beginners, in market analysis.
BOLLINGER BANDS
Bollinger Bands, created by John Bollinger in the 1980s, are used by crypto traders to measure volatility and buy/sell signals.
Bollinger Bands consist of:
- Midline (Simple Moving Average);
- Two outer bands (standard deviations).
Features:
- Outer bands expand during high volatility and contract during low volatility;
- Touching or crossing the upper band signals overbought conditions, which may indicate a sell signal;
- Touching or dipping below the lower band may signal oversold conditions, which could be a buy signal.
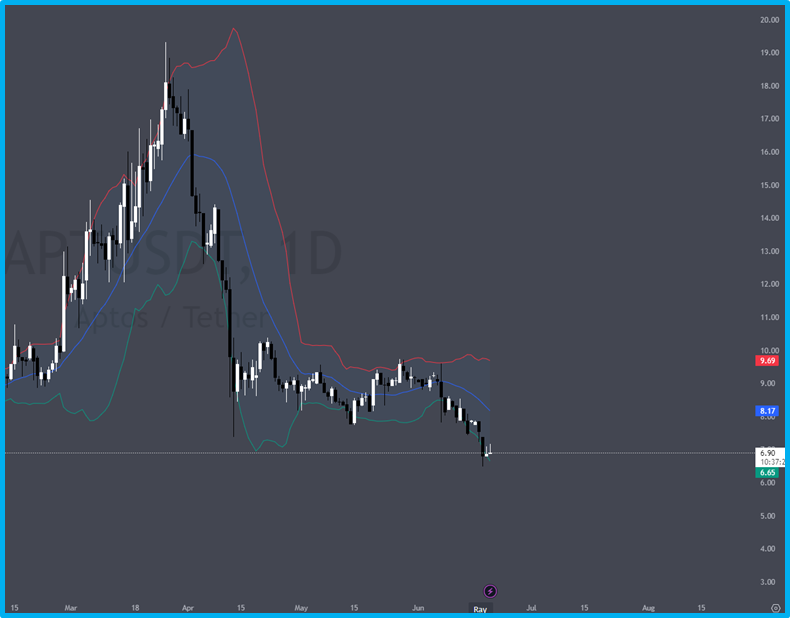
Fig. 12 - Example of Bollinger Bands APT/USDT 1D on Coinbase
PROS AND CONS OF BOLLINGER BANDS
Bollinger Bands are a tool that helps traders assess market volatility and identify entry and exit points. They are based on a simple moving average and standard deviation of prices. The bands adapt automatically to current volatility, making them user-friendly.
However, in periods of low market activity, false signals can occur when prices repeatedly touch the bands.
CONCLUSION
Using indicators can significantly strengthen your trading strategy in 2024. They provide key signals for making informed decisions in the volatile cryptocurrency market.
As the importance of the cryptocurrency market grows, it is crucial to stay updated with the best indicators and continually improve your trading strategy.
Recommendation: Use multiple indicators to confirm signals, which helps reduce risks and increase the likelihood of profitable trades.
!!! Note: Please observe Risk Management (RM) and Money Management (MM), and conduct your own research (DYOR) before making any purchases.
Want to learn more about crypto arbitrage?
Get a subscription and access the best tool on the market for arbitrage on Spot, Futures, CEX, and DEX exchanges.

You might be interested
What is the Fear and Greed Index?
Beginner's Guide to Basic Technical Patterns
