Best Volatility Indicators for Crypto Trading: Complete Guide
Best Volatility Indicators for Crypto Trading: A Complete Guide
Cryptocurrency markets are known for their high volatility, which makes trading in them not only attractive but also risky. It is important to understand how to measure and interpret volatility in order to make successful trading decisions.
There are many indicators, indices and tools that provide traders with valuable information about market conditions. The most popular trader's tools are volatility indicators: they analyze market indicators and then provide information about market excitement, possible entry points, near term reversal and other market events.
In this article, we will look at the main volatility indicators that will help traders navigate the dynamic changes in cryptocurrency prices.
Understanding volatility in cryptocurrency
Definition and importance
Volatility is a measure of the change in price over a certain period of time. Cryptocurrencies are a highly volatile market because digital assets are considered a risky type of investment, so if anything happens, investors immediately withdraw funds from them.
Before the emergence of cryptocurrencies, the most volatile market was the stock market: it is still volatile, but compared to cryptocurrency, its daily price change is in the order of acceptable.
Market factors
The volatility of cryptocurrencies is influenced by the following factors:
-
Industry news. For example, if some famous company or person acquires a large amount of cryptocurrency, it will not go unnoticed. Market participants will want to buy the same cryptocurrency, because the famous company does not just buy it, which will provoke the growth of the digital asset - volatility;
-
Government regulation. For example, at the end of 2024 Donald Trump said that the plan to create a state reserve of BTC - this provoked the growth of bitcoin, because if the U.S. will accumulate the main cryptocurrency, then other countries, sooner or later, will also want to join;
-
Market interest. Cryptocurrency must be interesting to traders, by its product or the opportunity to make money. If one of these conditions is present, the cryptocurrency will be bought and sold, and the price will remain volatile;
Impact on trading
Volatility has helped attract traders to the cryptocurrency market. Where there are high price fluctuations and large profits, or losses. Large capitals are not interested in the volatility of the crypto market, as they can incur large losses for a single price movement. That is why it took institutional investors with big money so long to enter the market. All the time before them, it was dominated by medium and small capitals who could get super profits for their investments. It should also be taken into account that volatility can bring not only large profits, but also losses, which can “eat” the entire capital of the investor.
Risks and their accounting
Volatility forces crypto market participants to take into account the risk in trading and investments. Competent risk management will reduce their number, and its list includes a number of basic principles:
-
There should be a clear percentage that you are willing to withdraw on a trade. This percentage should not change from asset classification, it should always be the same. Traders who use low-risk strategies for trading recommend not exceeding 2% per trade. It is important to keep in mind that this percentage is counted together with all the estimated fractions. If the amount of entry together with dolivy became equal to 2% of the deposit - it remains to wait for the result of this transaction;
-
Diversification of risks. When investing and trading, try to distribute your capital among different assets. If it is stocks, you should choose companies from different sectors: for example, IT and oil companies. Or it can be completely different assets: for example, cryptocurrency and bonds. If you concentrate all your money in one type of asset, you will suffer serious losses in this market at the moment of drawdown;
-
If you notice a sharp impulsive movement in the market, you should never trade on it. You can enter under its end, when the price starts to roll back to the previous values. Therefore, you should always stick to your trading strategy and not get distracted by fleeting market movements;
-
Always set a stop loss to avoid losses. Even trades that you are 100% sure of can go in the wrong direction, which can cause you to incur losses. So, to reduce your risks, set a stop loss when you open any trade. Yes, you may incur a small loss when the stop loss is triggered, and then the price may turn around and continue to rise. In theory, you lost profit because of the stop-loss and incurred losses. But in practice - the price may not turn around, that is, the losses would have been many times greater;
-
It is worth defining a loss threshold for a day, week and month. If you see that you are approaching one of the thresholds, you should reduce the percentage of each trade or stop trading for a while;
-
You should only trade with the funds that you will not end up with. If this is your last money for existence, you should not enter the market with it. You should forget about the funds you are trading with so you can make better decisions;
-
Take trading responsibly: it is not a game or a casino, it is a job that you have to do well to get your paycheck.
Following these simple rules will help when dealing with cryptocurrencies.
Overview of crypto trading indicators
Types of indicators
There are two types of indicators:
-
Statistical. They measure the deviation of the price from the average. Example: standard deviation;
-
Technical. The result is formed on the basis of data that can signal possible trends. Example: Bollinger Bands;
Basic concepts
Almost all volatility indicators are based on historical data, which allows analyzing the current level of activity in the market. The main concepts include:
-
Measuring price amplitude - the higher the amplitude, the greater the volatility;
-
Analyzing market noise - volatility helps to understand whether current fluctuations are significant or not;
-
High volatility indicates the possibility of prices rising or falling quickly, which creates trading opportunities.
Principles of use
Change monitoring
Regularly monitoring market conditions allows market participants to adapt to changing conditions, for example:
-
If volatility is falling, a trader can expect a period of consolidation;
-
If volatility is rising, a trader should prepare for a possible breakdown of support or resistance levels.
Trend Confirmation
Volatility is often used to validate trend signals:
-
If the Bollinger Bands are widening, the beginning of a trend movement can be confirmed;
-
If Chaikin volatility increases, it can indicate increasing activity in the market, confirming a trend.
Key volatility indicators
Indicator 1: CVI Volatility Index
A specialized technical indicator that is used to measure the volatility of digital asset prices. Through advanced statistical techniques (logarithmic returns and variance), CVI helps to understand the overall level of apprehension in the market, which can be useful for predicting sudden movements in cryptocurrencies.

Indicator 2: Standard Deviation
Measures the volatility of cryptocurrencies and calculates the deviation of the price from the average. As a rule, the higher the deviation from the standard price, the more turbulent the market situation. And vice versa: the smaller the deviation, the more stable the market is.
Indicator 3: Bollinger Bands
The indicator is a three-line band: the middle line is based on the simple moving average (SMA), the upper and lower lines reflect the deviation from the average SMA. With the help of Bollinger Bands, traders determine the volatility and trend in the price of a cryptocurrency. For example, the farther the bands are from each other, the higher the volatility in the market. If the bands are not far apart, the volatility is not high.
Indicator 4: Keltner Channels
A technical analysis tool that measures the volatility of cryptocurrencies and determines the direction of the market trend. As with Bollinger Bands, Keltner Channels consist of three lines: the center line, the exponential moving average (EMA), and the upper and lower lines represent the average true range (ATR) of the previous price action of the asset. The top line is above the moving average and provides information about potential resistance levels, while the bottom line is below the moving average and indicates possible support levels.
Indicator 5: Choppiness Index
An indicator that allows you to determine whether the market is trending or sideways. The index works in the range from 0 to 100, where 0 is a trending market and 100 is a sideways market without a clear trend.
There are also a few rules of interpretation:
-
Above 61.8 - a sideways market;
-
Below 38.2 - a trending market;
-
Crossing the 60 level means a potential transition from sideways to trending or vice versa.
Advanced volatility tools
Tool 1: ROC (Rate of Change)
An indicator of the rate of change in prices. With its help you can measure the dynamics of price fluctuations and at what speed it happens. I interpret the indicator as follows: positive values indicate upward momentum or buying pressure, while a negative value indicates downward momentum and selling pressure.
Tool 2: Volatility Close-to-Close
A rather interesting indicator that only takes into account the closing prices of cryptocurrencies. It is highly popular among traders for the reason that it does not take into account intraday price fluctuations. The value of a cryptocurrency could vary throughout the day, but at the end of the day it will return to the value of the previous day, because of which Volatility Close-to-Close does not show a complete picture. However, it can be used in certain cases of analysis, for example, for various funds, where the calculation of net asset value occurs once a day or week.
Tool 3: OHLC Volatility
The indicator shows the intensity and speed of price movements, thanks to which it can indicate the phase of the candle distribution: a candle with a new high and low during a volatility period is usually larger than a number of previous ones. When using OHLC Volatility, it is worth considering that with each new candle the data is updated and historical calculations are performed, even on sub-minute timeframes.
Tool 4: Chaikin Volatility
The indicator focuses on the difference between the maximum and minimum price for a certain period, helping to determine the moment of increasing or decreasing volatility. To calculate the indicator, it is necessary to calculate the spread - the difference between the maximum and minimum values of the current bar. This value is smoothed by the exponential moving average for the set period.
Tool 5: RVI Index
An indicator that helps to determine the direction of cryptocurrency price volatility. It compares the average of upward price changes with the average of downward price changes over a certain period. RVI can tell you about:
-
The overbought or oversold nature of the cryptocurrency;
-
Divergence: if the price is rising and the RVI is falling, it can be a signal that the current trend is weak;
-
When the RVI goes from negative values to positive values, it may signal the possible start of an uptrend;
-
When the main line crosses the signal line from bottom to top, it can be a buy signal, and when it crosses from top to bottom, it can be a sell signal.
Methods of technical analysis
Combined use of indicators
In any market traders do not limit themselves to a single indicator for predicting the price. This is done in order to be fully confident in the received signals. Here are some popular indicator combinations:
-
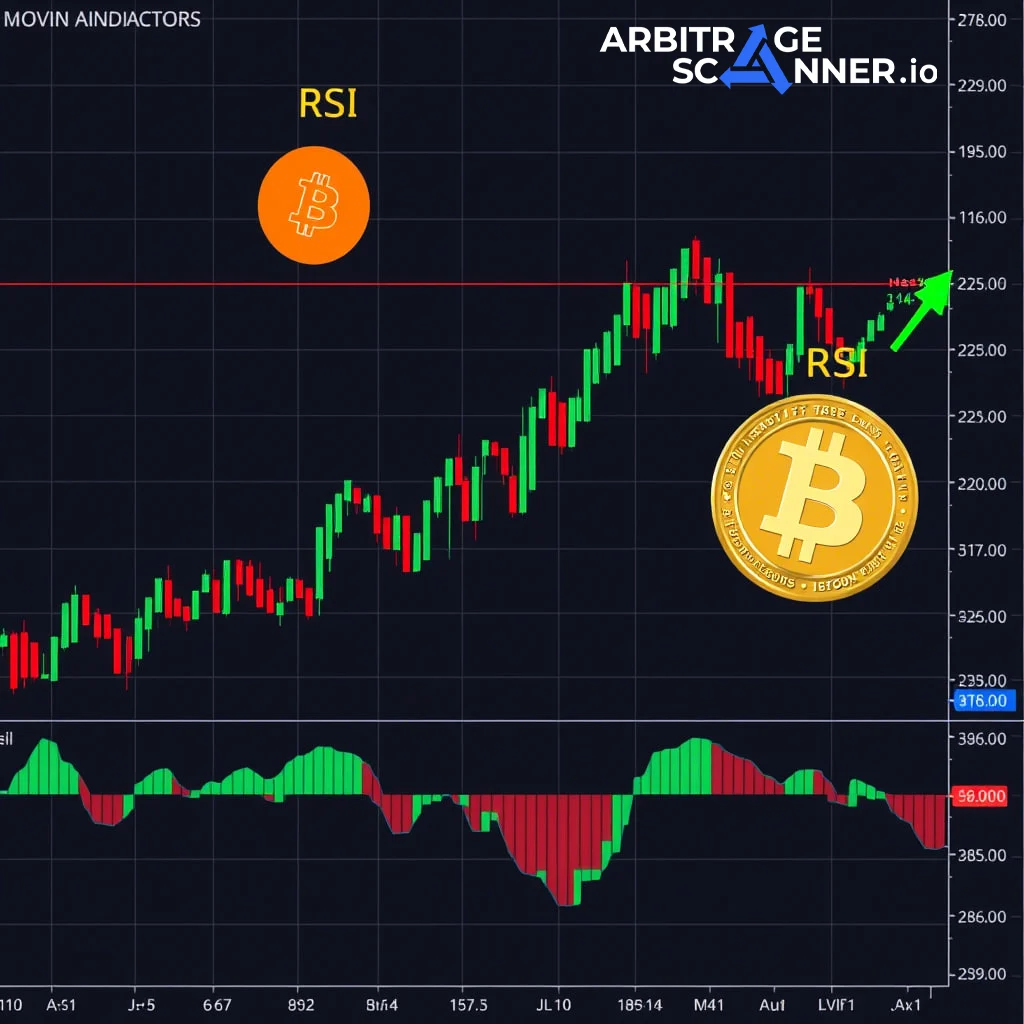
Moving averages, MACD and RSI. This combination provides a comprehensive strategy combining trend identification, momentum confirmation and overbought or oversold analysis;
-
Bollinger Bands, Stochastic Oscillator and ADX. Bollinger Bands provide information on price volatility and can indicate potential overbought or oversold conditions;
-
Ishimoku Cloud, MACD and Volume. The Ishimoku Cloud provides insight into trend direction, support and resistance levels, and potential breakout signals. The MACD confirms these trend signals, and volume analysis helps confirm the strength of price movements;
-
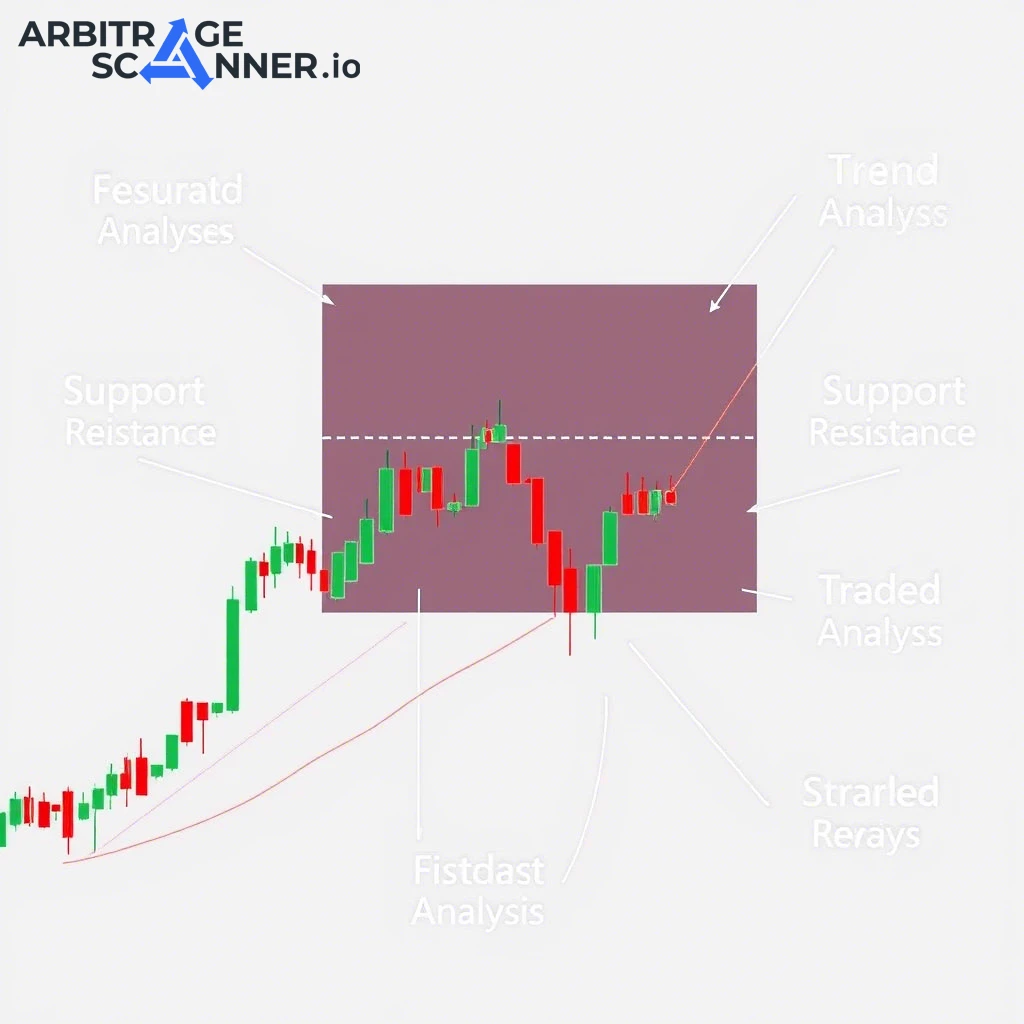
Support and resistance, moving averages and OBV (balance volume). Support and resistance levels help traders identify potential entry and exit points, while moving averages provide information on trend direction and potential reversal points.
Confirming Signals
By using volatility indicators, traders can avoid false signals, something that trend or volume indicators, for example, cannot provide: it's all about market conditions, which volatility indicators take into account, allowing traders to determine how reliable a signal is received. For example:
-
When the market is sideways, Bollinger Bands may show a narrowing range, indicating low market activity;
-
During periods of volatility spikes, the Choppiness Index shows whether or not the market has peaked, after which there is usually a correction.
Risk Management
High volatility increases the likelihood of significant price changes in a short period of time, which can lead to both unexpected gains and large losses. Volatility indicators allow you to:
-
Estimate the range of price fluctuations. Using standard deviation or Keltner channels, traders can understand how much prices can fluctuate and set adequate stop-loss and take-profit levels;
-
Adjust position size. When volatility increases, traders can reduce position size to reduce potential losses;
-
Avoid trading during times of excessive activity. If indicators such as Chaikin volatility show sharp spikes, this may be a signal to refrain from trading until the market stabilizes.
Making Trading Decisions
Volatility indicators allow traders to:
-
Decide whether to open or close a position. For example, if the standard deviation signals low volatility, the trader can prepare to open a trade, because it indicates an upcoming movement;
-
Evaluate market conditions. For example, the widening of Bollinger Bands signals the beginning of a trend movement, which can be a good time to enter, while their narrowing indicates a period of consolidation.
Conclusion
Volatility indicators are an important tool for cryptocurrency traders, helping to monitor possible changes in the market and make informed trading decisions. Using these indicators in combination with other methods of technical analysis can significantly improve trading efficiency.
Financial markets are organized in such a way that if a trader does not use all the tools available to him for analysis, his trading will go much worse than those who use them all. So if you are going to start trading cryptocurrencies or any other assets, you should start by learning how to read charts properly. Once you come to a full understanding of what's happening in the market, your trading process will be multiples easier.
FAQ
How do volatility indicators help with crypto trading decisions?
Volatility indicators help traders to assess the current market dynamics and predict possible price fluctuations, which allows them to make more accurate entry and exit decisions.
Which volatility indicator is best for beginners?
For beginners, it is recommended to start with simpler indicators such as Bollinger Bands and Standard Deviation, which are easy to interpret and use in trading.
Can volatility indicators predict a market crash?
Volatility indicators can help in identifying trends and sharp changes, but they cannot accurately predict sharp collapses. Rather, they provide traders with tools to monitor potential risks.
How often should traders check volatility indicators?
Traders should check volatility indicators regularly, especially during periods of high market activity, to assess current conditions and risks.
What is the best combination of volatility indicators?
There is no best combination of indicators, but rather one that suits the trader's specific objectives. You can use Bollinger Bands in combination with standard deviation or Keltner channels to get more accurate signals.
Want to learn more about crypto arbitrage?
Get a subscription and access the best tool on the market for arbitrage on Spot, Futures, CEX, and DEX exchanges.


