Bid and Ask in Crypto Trading: Complete Guide
with ArbitrageScanner!
Bid and Ask Price: The Complete Guide
The bid and ask price are two components without which financial markets could not exist. Any market participant wants to sell or buy an asset at the price they want, which forms the average market value and the relationship between traders or investors.
Understanding how bid and ask prices are formed helps traders make better informed decisions, manage risk effectively and maximize profits. In this article, we will look at the basics of bid and ask price formation, their impact on trading, and strategies to optimize trade execution.

Understanding supply and demand
Determining the bid price
The bid price is the highest price that a consumer is willing to pay for an asset. For example, if a merchant wants to buy bitcoin at a cost of 100,000 dollars, this number will be his bid price, according to which someone is able to buy BTC in the presence of the bid in the market.
Determining the bid price
The ask price is the minimum price at which a seller is willing to give up an asset. If a bitcoin owner offers it for $99,900, that amount becomes the ask price.
Relationship between prices
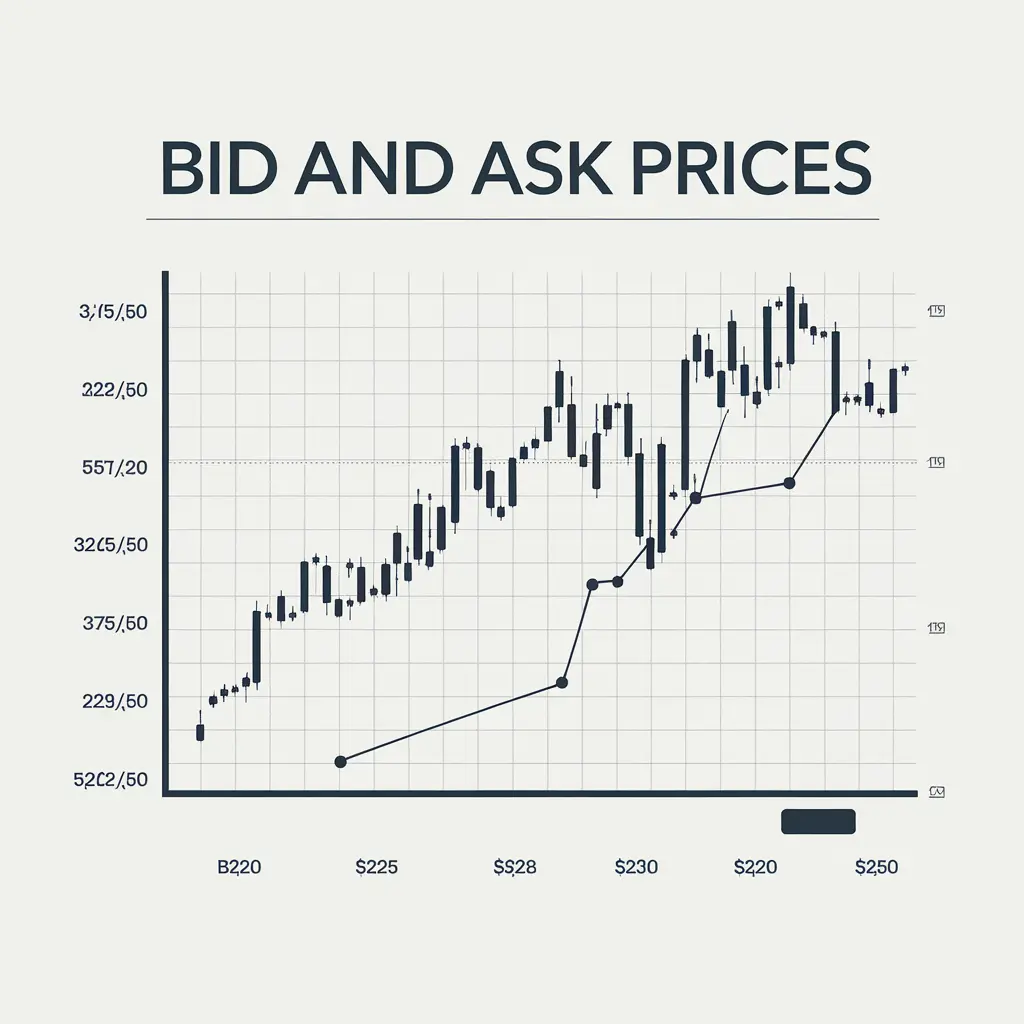
The difference between the bid and ask price is called the spread. The smaller the spread, the higher the liquidity of the asset. For example, if bid is $100,000 and ask is $99,900, the spread is $100 or 0.1%, which is a very small difference in price. There are assets whose bid and ask price can differ by several or even tens of percent.
This usually happens because of panic selling of unpopular assets. Most often it can be observed in altcoins: as soon as investors and traders decide to sell an asset en masse, they usually fail to do it for the price they planned. Some try to sell at an inflated price, while others try to buy at an undervalued price, which results in a large spread.
Market Dynamics
The movement of supply and demand prices determines the current market situation. When demand exceeds supply, the price of an asset rises, and vice versa. For example, on the cryptocurrency market there was news that bitcoin will be used as a state reserve in the United States. The event is positive and it means that bitcoin will be in demand. Therefore, sellers in the market can inflate the bid (ask) price because the asset is in demand right now.
Now let's consider the opposite example: let's assume that the cryptocurrency market spread the news about the ban on the use of bitcoin in international settlements by American companies. This event is negative and means that interest in bitcoin will decrease. In such a situation, sellers are forced to reduce the offer price (ask) in order to attract buyers, because the asset becomes less demanded.
Spread Analysis
Market Implications
A wide spread indicates low liquidity of an asset and can make it difficult to enter or exit positions. On the contrary, a narrow spread indicates high liquidity and makes trading more efficient.
-
On the popular BTC/USDT pair, the spread can be as low as $1-2 with high liquidity. This allows traders to easily enter and exit positions without significant slippage losses;
-
For less popular assets, such as illiquid tokens, the spread can reach several percent of the asset price. This wide spread makes trading less profitable and increases slippage risks for traders.
Liquidity Indicators
Spread is an important liquidity indicator. Assets with low spreads, such as BTC/USDT, tend to be more popular among traders than exotic pairs with wide spreads.
Impact on trading
When selecting trading pairs, it is important to take into account the volume of the spread. For example, the BTC/USDT pair usually contains a spread of several dollars, which makes it attractive for scalpers, and see why:
-
A low spread minimizes trading costs. Scalpers make a lot of trades, so even a small saving on each trade significantly affects the final profit;
-
High liquidity allows you to enter and exit positions quickly without significant slippage. It is extremely important for scalpers who hold positions for a short time;
-
Small spread increases potential profitability - even minor price movements can bring profit, covering trading costs
-
Spread stability. In the BTC/USDT pair, the difference between the buy and sell price rarely changes much, which allows for more accurate planning of transactions;
-
High trading volume creates good conditions for frequent transactions. This is one of the main factors in choosing a pair for a scalper.
Trading Mechanics
Price discovery
Price discovery in trading is the process of establishing a fair market price for an asset through the interaction of buyers and sellers. For example, if many traders place high bids, the price of an asset may rise, and vice versa.
Market Orders
A market order provides a quick execution of a trade at the current market price. However, they can be less profitable due to possible slippage.
Limit Orders
A limit order allows you to set a specific price at which a trader is willing to buy or sell an asset. This reduces the risk of unnecessarily high costs.
Market Scenarios
High Demands
When the bid price rises, it indicates an increase in interest in the asset. For example, if most traders start buying ETH, its price may rise significantly as the demand for the asset increases.
Low bids
A low ask price indicates that sellers are willing to give up their assets. For example, if SOL owners offer them cheaper than the market price, it will attract new buyers. By selling SOLs cheaper sellers will contribute to a decrease in the price of the asset.
Price equilibrium
Price equilibrium is achieved when supply and demand are in balance. For example, if bid and ask prices remain stable for a long period of time, it indicates a stable and neutral market sentiment.
Market Inefficiencies
Sometimes spreads may increase for a while due to lack of liquidity or news events. For example, spreads can grow during periods of significant financial demand, especially when comparing the value of an asset in different exchanges. For example, during periods of significant volatility, ETH can cost $3,000 on one exchange and $3,100 on another.
Trading strategies
Spread trading
Traders can use differences in spreads to make profits. For example, if one exchange offers a lower spread, you can use this opportunity for arbitrage: buy an asset cheaper on one platform and sell it more expensive on another. This is exactly the type of arbitrage our scanner is designed for.
Execution tactics
Correct use of the market and limit orders allows you to optimize the execution of trades. For example, when the market is moving quickly, it is better to use a market order, because it will be executed at the nearest price, while a limit order may not be executed due to price slippage.
Risk Management
Risk management includes the use of stop-losses and limiting the size of positions. For example, it is recommended not to withdraw more than 1-2% of capital per trade.
Market Timing
Analyzing spread movements helps to predict future price movements. For example, if the spread starts to narrow, it may indicate the approach of a significant movement, i.e. the market is consolidating - a period of equilibrium, when the forces of buyers and sellers are balanced, and the price fluctuates in a narrow range, after which it breaks through it to one side.
Platform tools
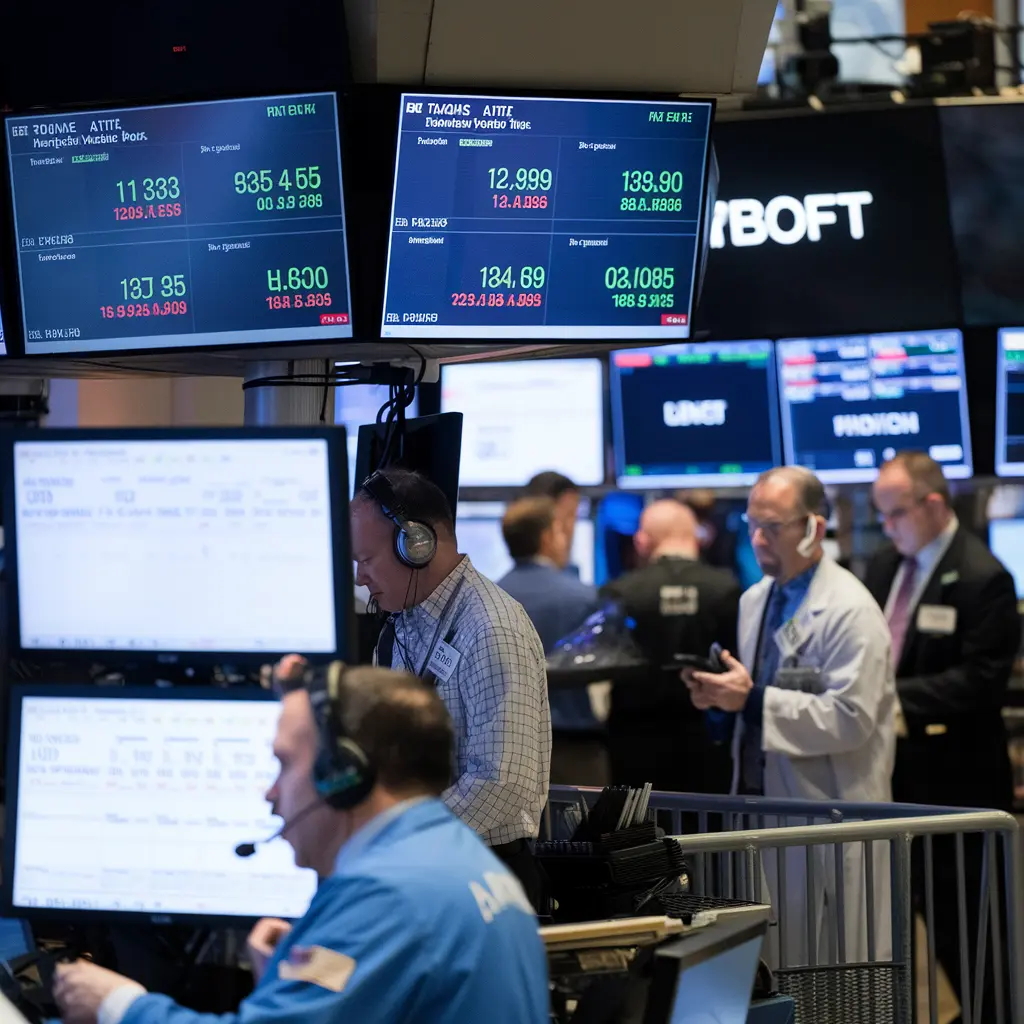
Order Book
The order book shows all current bid and ask prices, which helps traders analyze the market. For example, the depth of the order book can indicate potential bids or ask pressure.
Trading Interfaces
Modern platforms offer user-friendly interfaces for spread analysis and order management. For example, Binance has a feature that displays real-time spread charts, as well as many tools and indicators for analysis.
Analysis tools
Traders can use industry indicators to look at spreads. For example, RSI or MACD can help determine whether an asset unit is considered bought or re-exported. A normal discrepancy or Bollinger Bands, together with another edge, can help to establish market volatility.
Execution Options
Cryptocurrency trading platforms offer advanced order management tools, such as stop-limit and take-profit, which help traders minimize risk and maximize profit.
Stop-limit allows you to determine a certain value, further (for buying) or more (for selling) which the operation will not be concluded with, including in case the market moves rapidly.
Take-profit automatically closes the position if the asset reaches the specified target price, fixing the profit.
These devices can be especially useful in circumstances of high volatility, as they allow you to make a plan in advance and beware of emotional decisions, which is very important for the purpose of effective trading.
Conclusion
Demand values as well as prescriptions are considered to be the main components of effective cryptocurrency trading. Interestingly enough, they can be used to provide a significant amount of data to the trading participants, which can help them to profit from trading. But first of all, the trader will correctly explain the acquired data, all without exception as it turned out to be much more difficult, compared to the ability to appear at first glance. But our devices are intentionally invented for this purpose, in order to greatly simplify the problem for you in the presence of considering bazaars or arbitrage cryptocurrency.
Frequently Asked Questions
Why do spreads differ for different cryptocurrencies?
Spreads depend on the liquidity of the asset. The most common cryptocurrencies, such as bitcoin, as well as the principle, have the most limited spreads.
How do market makers have a big impact on spreads?
Market makers keep liquidity high by providing demand values as well as prescriptions. Their influences have a chance to limit spreads, making selling more efficient.
What causes unexpected changes in spreads?
News actions, changes in legislation or significant transaction sizes can cause a rapid increase in spreads.
How do I use spreads to make trader's conclusions?
Spread analysis can help you set the time to enter or exit positions. For example, a narrow spread can indicate favorable trading conditions.
What is the relationship between liquidity and spreads?
Greater liquidity is usually accompanied by narrow spreads, which makes selling more tempting for traders, as well as vice versa.
Want to learn more about crypto arbitrage?
Get a subscription and access the best tool on the market for arbitrage on Spot, Futures, CEX, and DEX exchanges.

