Crypto Candle Analysis: Complete Trading Guide
with ArbitrageScanner!
Cryptocurrency analysis: a complete guide to trading
One of the main questions for many novice traders in the crypto market is the choice of the type of analysis to predict further price movement. Most market participants agree that the best indicator of an asset is its price, and it is better to analyze it with the help of candlesticks on the chart.
Candlestick analysis in crypto trading is one of the varieties of technical analysis, thanks to which traders get information about the further movement of the rate based on historical data. This type of analysis is preferred by market participants because of its simplicity and visual appeal: it is enough to learn a few basic figures (patterns) to understand roughly where the course will go.
Japanese candlesticks appeared back in the 18th century, and by our time they have learned to interpret them correctly, so candlestick analysis has become an indispensable tool for traders who want to make money on rate movements. Read about what candlesticks show, what patterns there are and how to determine them correctly in this article.
Understanding candlesticks - basic concepts
A Japanese candlestick is information about the price movement of an asset, which looks like a vertically arranged rectangle. The end and beginning of the candle shows how much the asset was worth at the moment when the selected period began or ended. For example, if a period (timeframe) of 1 minute is selected, the beginning of the candle will show how much the asset was worth at the opening of the period, and the end will show how much it was worth at the closing.
Also, the price indicators can change depending on the color of the candle. The green color indicates that for the selected timeframe the rate of the asset has increased, which means that the opening price will be at the beginning of the candle (bottom), and the closing price at the end (top). On the contrary, if the color of the candle is red, then the rate of the asset for the selected timeframe has decreased, which means that the opening price will be at the top and the closing price at the bottom.
A candle can have a “tail” - a line going up or down from the rectangle. The tail of the candlestick shows where the price of the asset moved during the selected timeframe, but did not consolidate there. That is, a candlestick can have an opening and closing price, as well as a tail, where the price was also, but did not stay at the time of opening or closing of the period.
Timeframes can be different: minute, hour, day, week, month and so on. You can also customize smaller periods, for example, a second, 5 seconds, 10 seconds. The time frame chosen for candlestick analysis will determine what information the trader wants to get: the longer the period, the longer the price is predicted for, and vice versa.
Candlesticks have replaced the usual, linear chart: with their help you can see four indicators - these are the opening and closing price, as well as the maximum and minimum price for the period. Thanks to candlesticks, it has become much easier to conduct graphical analysis, because among them you can easily find patterns that signal the future direction of price movement.
Candlestick Interpretation
Candlestick analysis is used to find certain figures (patterns) on a chart. Usually a pattern contains from one to three candlesticks, there are exceptions, but all of them have two purposes:
-
To warn of a price reversal;
-
To warn about the continuation of the trend.
Any analysis has individual features, and candlestick analysis is no exception. It has a number of factors, knowledge of which will reduce the time for its correct interpretation, which will allow you not to lose money in the wrong open deal.
-
The most accurate time frames for candlestick analysis are hourly and daily, as it is believed that they are much more often used by traders, compared to other periods. The point is that the market is ruled by psychology, and if millions of traders around the world use these timeframes and follow what the analysis showed, then the price of the asset will go in the direction that the pattern showed;
-
Patterns where a gap is present are considered to be more accurate. A gap is a price gap between two neighboring candles. Simply put, it is a void in the candlestick chart. A gap occurs only during an impulsive price movement, i.e. when sellers or buyers prevail, which makes patterns with it more informative;
-
The pattern must be justified. That is, if a pattern appears on the chart, the next candle must confirm it, otherwise the signal may be false.
Basic Candlestick Patterns
Doji patterns
Doji is a candlestick that has a small body or nobody at all. On the contrary, the tail or shadow is longer than that of regular candles due to the absence of the body. This state of affairs indicates that the forces of sellers and buyers on a particular asset are equal. Often such a picture can be observed at the moment of a prolonged sidewall, when it is not clear where the price will go. There is an opinion among traders that doji is a yellow traffic light signal, i.e. market participants should better prepare for the formation of a new trend.
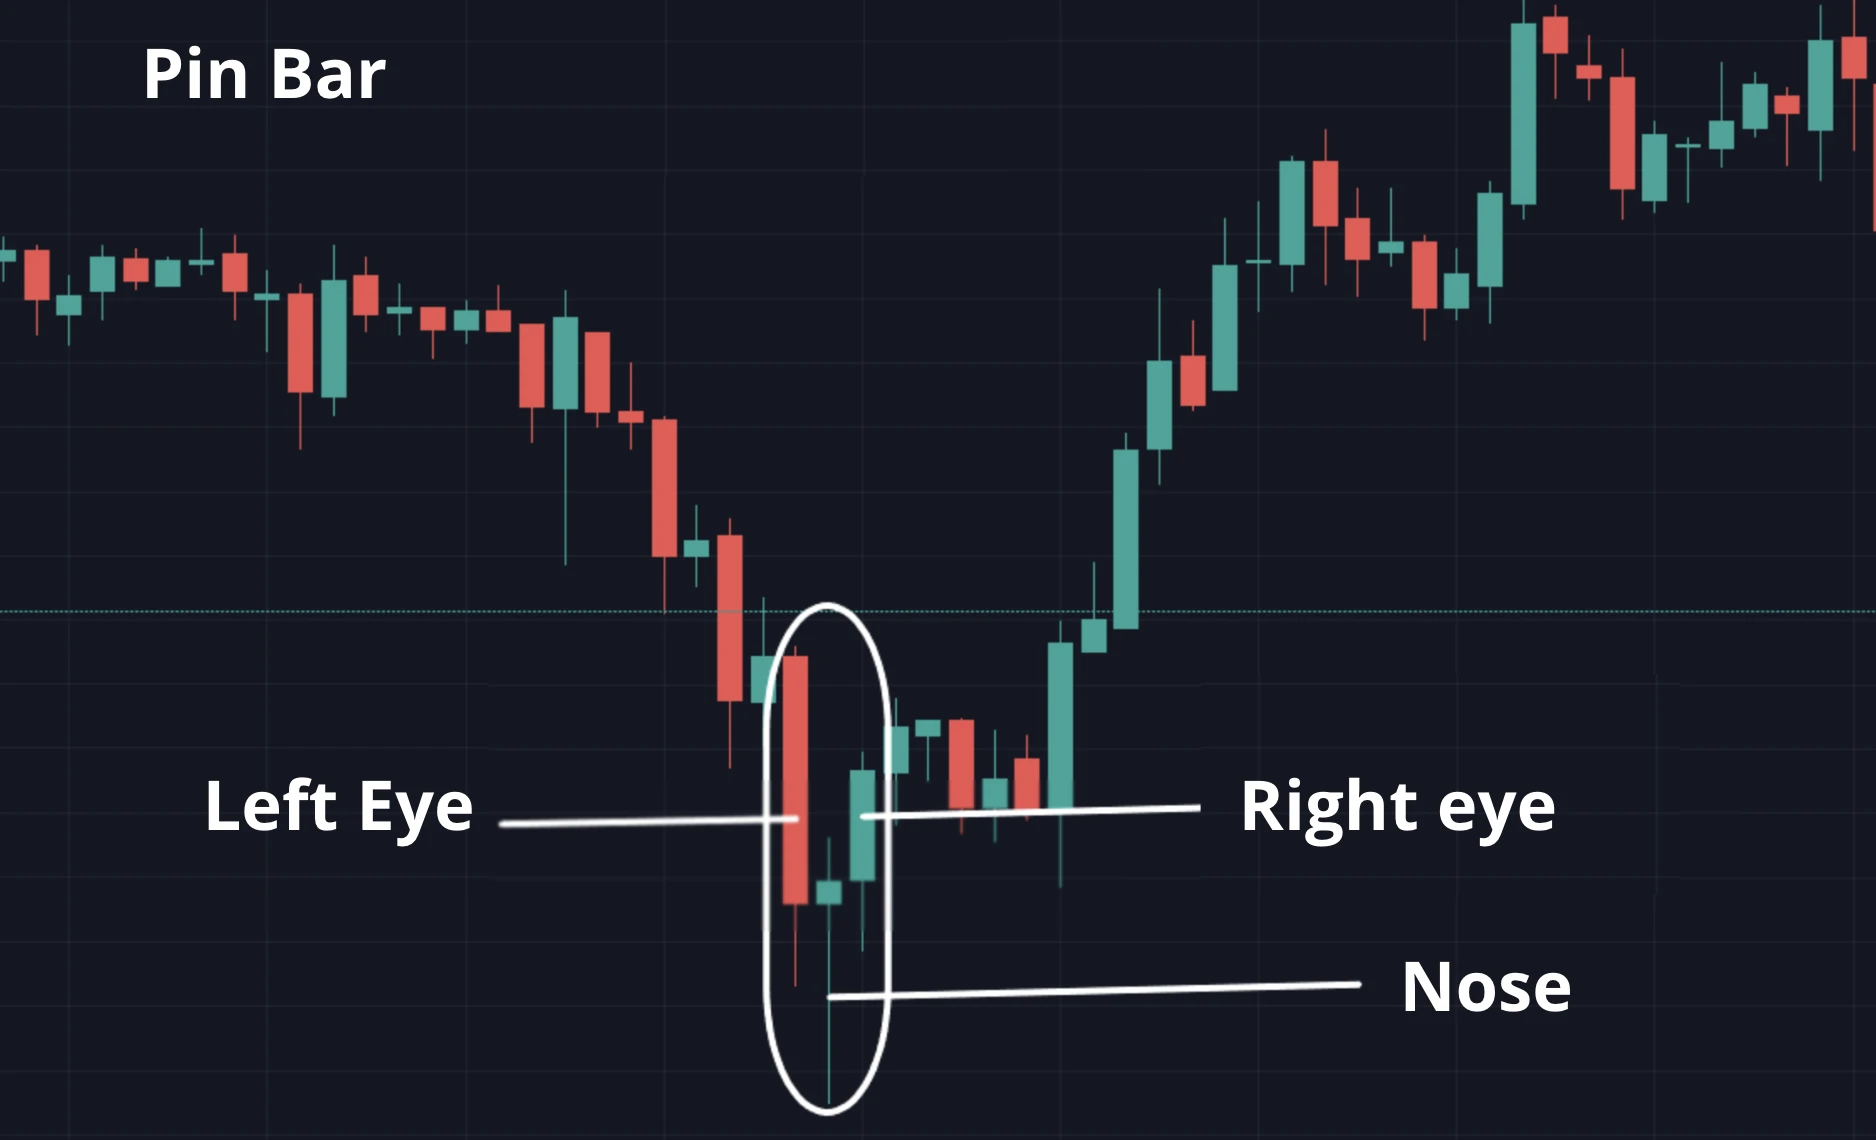
Pin Bar
Pin-bar is the full name of Pinocchio Bar. If you find this pattern on the chart, it will look like the face of Pinocchio from the cartoon of the same name: it consists of three candlesticks, the central one has a small body, and the tail is several times larger than it, as if resembling the long nose of the character.
A Pin Bar indicates that the price tested an important support or resistance level, but failed to overcome it, which usually means a trend reversal.
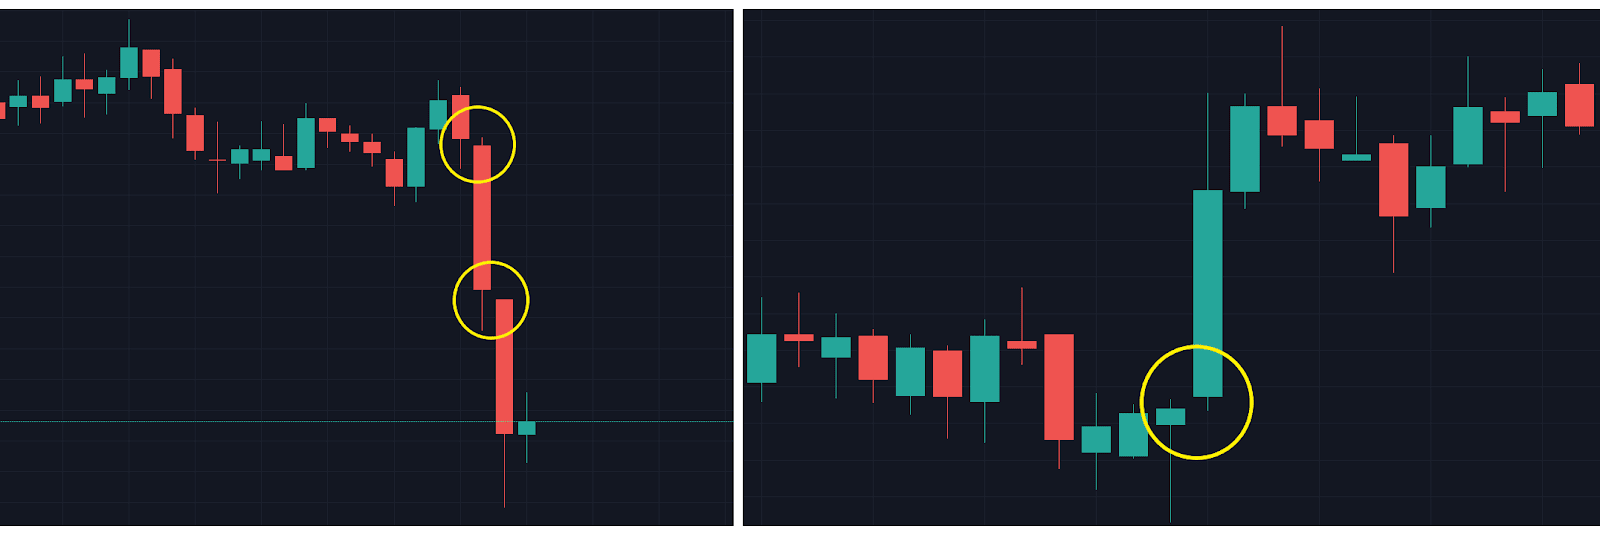
Gap or gap
As already mentioned, it is one of the most informative patterns, as it occurs much less frequently than other patterns. For example, at the moment of bitcoin's impulsive growth, sellers want to get $100,000 for it, but the nearest offer to buy is only at $99,900, which results in a price gap at the moment of closing one candle and opening the other. This situation indicates that the sellers are seriously outnumbering the buyers, but it could be the other way around.
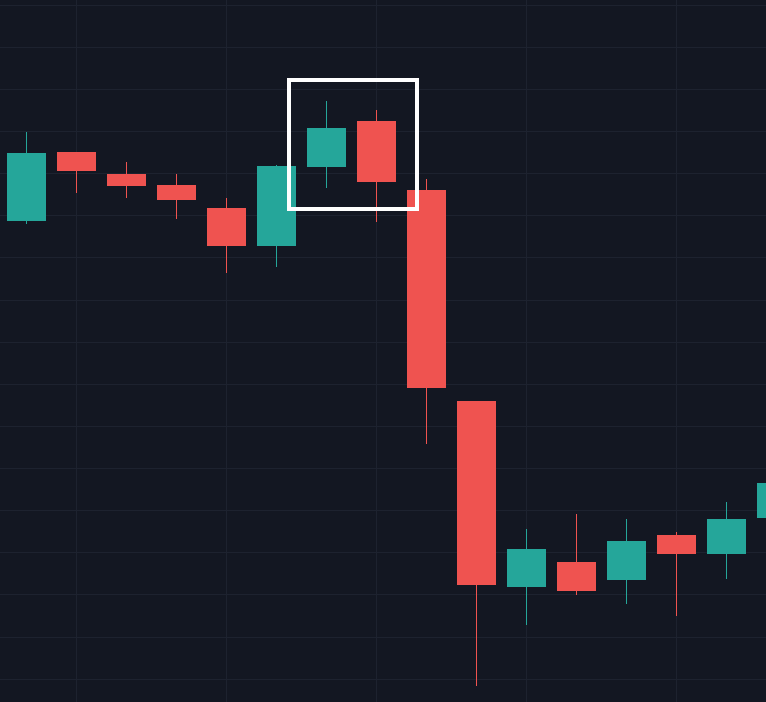
Absorption
It consists of two candlesticks, where the second candlestick is necessarily larger than the first one, and on the chart it may appear as if it absorbs it. There are two types of absorption: bearish and bullish. If a green candle absorbs a red candle, an uptrend is expected. On the contrary, the absorption of a red candle by a green candle will signal the beginning of a downtrend.
Key trading patterns
Bullish patterns
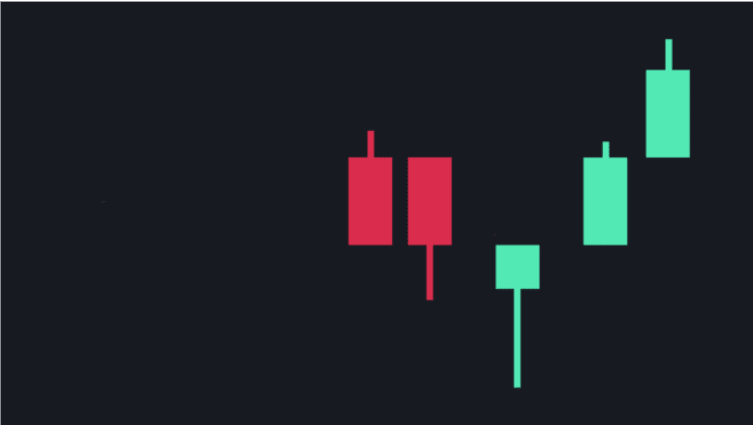
Hammer
A pattern that looks like a candle with a long tail at the bottom of a downtrend. A prerequisite is that the tail of the candle must be at least twice as big as its body.
The figure indicates that buyers have withstood the pressure of sellers, so the body of the candle is short and the tail is long. The hammer indicates a powerful bullish reaction and a possible trend reversal.
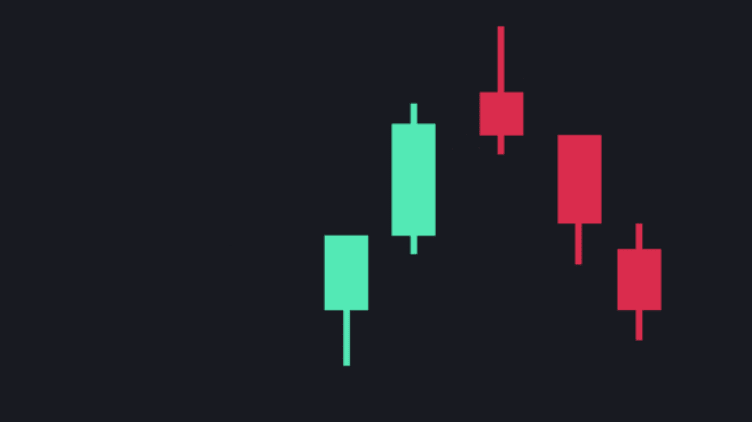
Three white soldiers
The pattern looks like three green candles, each of the following candles should open inside the body of the previous one and close above its highest point, including the tail. The pattern indicates that the price continues to rise under constant buying pressure, and the candles can be used for a probable consolidation or pullback.

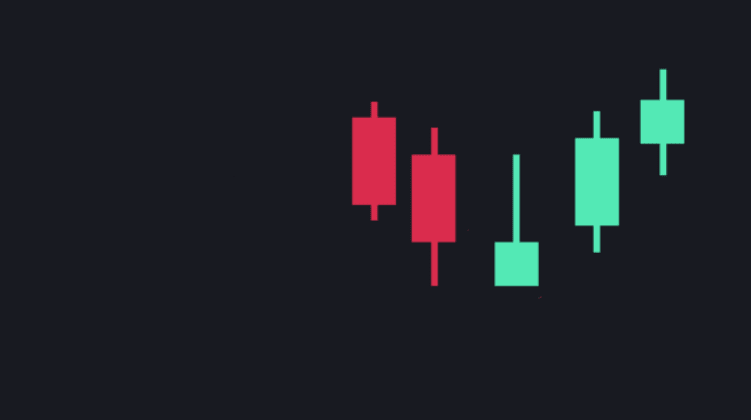
Inverted Hammer
The pattern is similar to the regular hammer, but it has a longer “handle” above the candle, not below it, which should exceed the body by at least 2 times.
The pattern appears at the bottom of a downtrend and indicates a potential reversal. A long shadow on top of the candle indicates that buyers have stopped selling pressure, so the candle closed near its opening level. An inverted hammer often indicates buyers controlling the market rather than sellers.
Bear patterns
Hanged Man
This pattern is an analog of the bullish hammer: it is formed at the end of the uptrend, the candlestick body is short and the lower tail is long, which indicates that the bears tried to reverse the course, but the bulls survived. At the same time, this state of affairs means that the buyers are starting to give up their positions, and soon there will be a break in the trend, where the sellers will prevail.
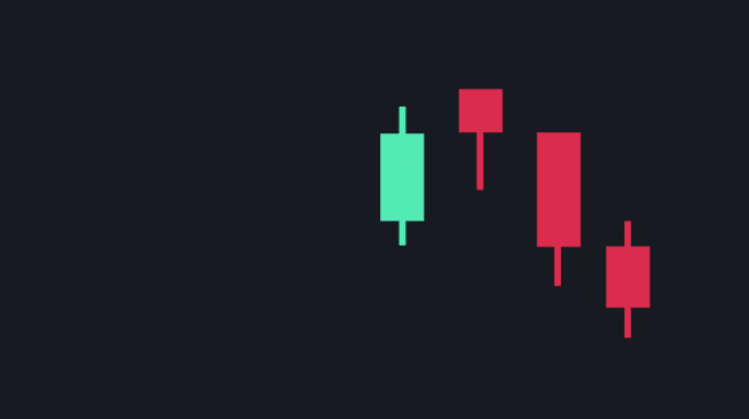
Shooting Star
This pattern consists of a single candlestick with a medium-sized body, a long upper tail and a short or no lower tail. The pattern indicates that the market has reached a maximum: buyers did not resist and sellers regained control, after which they began to reduce the price.
It is worth considering that many traders prefer to find additional confirmation of the shooting star, as they do not consider the pattern reliable.
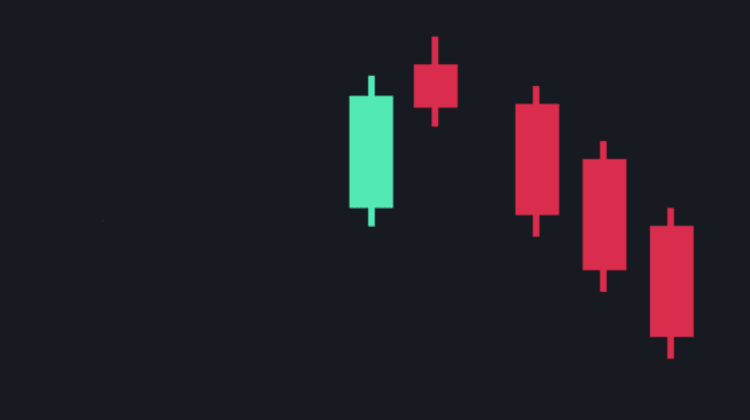
Three Black Crows
The pattern is the bearish equivalent of three white soldiers: the figure consists of three candles, each of the following candles opens inside the body of the previous one and closes below its minimum point.
It is important that when the pattern is detected, the candles do not have long tails on top, as their absence indicates constant selling pressure, and this will serve as a confirmation of the trend.
The process of analyzing patterns
To correctly identify the pattern and the information obtained, you need to:
-
Select the correct time frame. For example, if a trader prefers intraday trading, he should use small timeframes: 5, 10, 15, 30 minutes. If an intraday trader will use a daily timeframe, he may find the pattern, but the price movement will be confirmed in the perspective of one or several days, not in the next few hours;
-
When reading the chart, you should try to look for all possible patterns, and not fixate on finding one. It is clear that a trader cannot keep all possible patterns in his head, so it is better to use tools such as the Japanese Candlestick Patterns Indicator. This indicator scans the chart and identifies more than 30 different patterns, providing possible entry and exit points;
-
Each pattern requires confirmation. In some cases it is better to wait for another pattern, or you can use different indicators or market data to confirm the theory.
Using patterns in crypto trading
To effectively find and interpret patterns during crypto trading, you need to adhere to the following rules:
-
To find a pattern, you need to study candlestick analysis. It may sound mediocre, but newcomers to the market can memorize a couple or three basic patterns and try to find them on the chart, missing many others. In this article we have covered the most popular and frequently appearing patterns on the charts, but that doesn't mean that there aren't others;
-
Do not forget about technical indicators, which will help in the correct interpretation of the market situation. For example, the hammer pattern can be confirmed by the trading volume of the asset. If a hammer is formed and buy orders will prevail, it will confirm the pattern and help to make the right trading decision. Also, as an example, you can use the RSI and MACD indicators, which combine well with candlestick analysis;
-
Use different time periods for candlestick analysis. It may happen that on the 15-minute timeframe there is a pattern, but on the daily timeframe there is no pattern. If a trader does not check the daily timeframe, it can lead to a wrong decision and losses;
-
As with any trading strategy, you need to use risk management tools in candlestick analysis. It is worth remembering that this is a market, and 100% information about further price movement you will never get, you can only guess. Therefore, be sure to use stop-loss orders to protect your deposit.
Technical tools
Trading platforms
Various platforms are used to analyze and trade candlestick patterns:
-
TradingView - a popular platform with a wide range of tools for technical analysis, including indicators and pattern scanners;
-
MetaTrader 4/5 (MT4/MT5) - suitable for automatic pattern detection;
-
Binance, Bybit, OKX, KuCoin - exchanges with integrated charts for analyzing candlestick patterns;
-
ThinkorSwim, NinjaTrader - advanced platforms with custom indicators.
Analysis tools
Traders use to identify and confirm candlestick patterns:
-
Horizontal support and resistance levels - help identify reversal zones;
-
Fibonacci levels - confirm pullbacks and corrections;
-
Trend lines and channels - show the general direction of price movement;
-
Volumes (Volume, OBV, VPVR) - help to evaluate the strength of the candlestick pattern.
Technical indicators
Candlestick patterns are strengthened when confirmed by the following indicators:
-
MACD (Moving Average Convergence Divergence) - filters false signals, identifies divergences;
-
RSI (Relative Strength Index) - confirms overbought or oversold;
-
Bollinger Bands - shows volatility levels, helps to identify breakdowns;
-
EMA/SMA (moving averages) - helps to filter the trend and identify entry points.
Conclusion
Candlestick analysis is a powerful tool for traders that allows them to predict further price movement based on historical data. Japanese candlesticks give a clear visual representation of market dynamics, and understanding the main patterns helps to make informed trading decisions.
However, it is worth remembering that no method of analysis gives a 100% guarantee of success. To increase the accuracy of forecasts, candlestick patterns should be used in combination with support and resistance levels, volume indicators, oscillators (RSI, MACD) and other technical analysis tools.
The main rule of a successful trader is discipline and risk management. Use stop-loss orders, do not risk your entire deposit in one trade and do not trade on emotions. The more practice and experience in analyzing candlestick patterns, the better the trading results will be.
Frequently Asked Questions (FAQ)
What are the most reliable candlestick patterns for cryptocurrency trading?
The most reliable candlestick patterns include:
-
Takeover - a strong trend reversal signal;
-
Hammer and Hanged Man - indicating a possible reversal;
-
Doji - a signal of uncertainty, especially at key support/resistance levels;
-
Three white soldiers and three black crows - confirm trend strength.
How to combine candlestick analysis with other indicators?
To increase the accuracy of signals, use candlestick patterns in combination with:
-
Support and resistance levels - confirm trend reversal or continuation;
-
Volume indicators (OBV, Volume) - help to assess the strength of the movement;
-
Oscillators (RSI, Stochastic) - confirm overbought or oversold;
-
Moving averages (MA, EMA) - filter false signals and show the trend.
What time frames are best suited for candlestick analysis?
-
Daily (D1) and 4-hour (H4) - the most reliable for medium-term trading;
-
Hourly (H1) - suitable for short-term trades;
-
5-minute and 15-minute (M5, M15) - used for scalping, but less reliable due to market noise.
How to confirm candlestick pattern signals?
-
Wait for the candle to close on the selected timeframe;
-
Check volumes - high activity strengthens the signal;
-
Evaluate the context - whether the pattern coincides with a trend or support/resistance level;
-
Use additional indicators (RSI, MACD, Bollinger Bands).
Want to learn more about crypto arbitrage?
Get a subscription and access the best tool on the market for arbitrage on Spot, Futures, CEX, and DEX exchanges.

