DMI Trading Indicator

with ArbitrageScanner!
The Directional Movement Index (DMI) is an advanced technical analysis tool created by J. Welles Wilder in the late 1970s to help traders find directionality and measure the strength of price movements. The DMI is more helpful than traditional oscillators for filtering out price noise by determining if an asset is in a trend or just moving sideways.
Understanding DMI
Core components
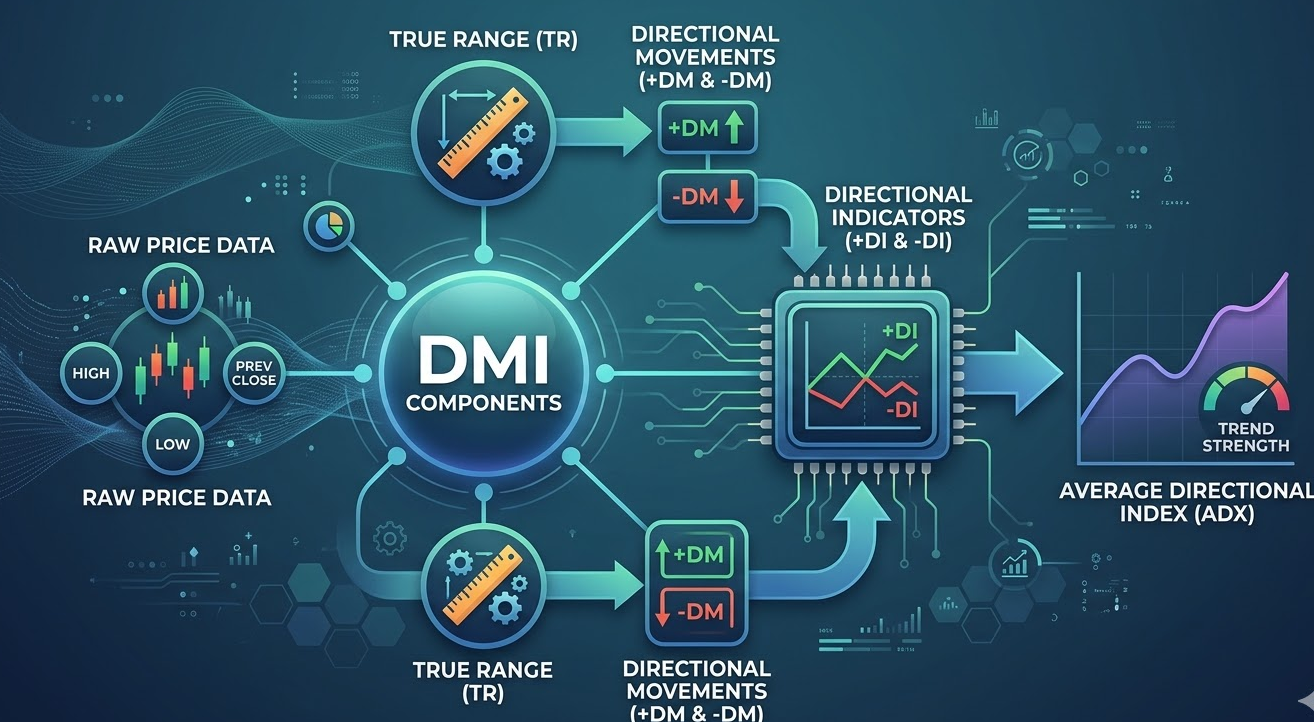
DMI takes a system-level view of the interaction of the three core components of DMI to provide a comprehensive three-dimensional perspective of market activity:
- Positive Directional Indicator (+DI) - The +DI measures the upward trend direction and increases when the new high is greater than the last high.
- Negative Directional Indicator (-DI) - The -DI measures the direction of the downward trend, and the -DI increases as the new low is less than the last low.
- Average Directional Index (ADX) - The ADX tells us how strong the price move is, but does not tell us if the price is up or down. It provides an indication of the degree of price movement.
Calculation methods
To calculate the DMI, you will need to first compute the True Range (TR) and the Directional Movements (+DM and -DM). To determine how much price activity varies in the market for calculating True Range (TR), you need three types of data: current high; current low; and previous close. From the three ranges above (highs minus lows), you can calculate TR. Directional Movement Index (DX) is found by taking the absolute value of the difference between +DI and -DI, dividing that by the total of both +DI and -DI. The Average Directional Movement Index (ADX) is calculated by applying a moving average function to DX, which will create a smoothed representation of DX, so you can determine how strong the current price trend is.
Signal interpretation
Once you understand the ADX and DMI formula for calculating ADX, DMI +DI, and DMI -DI, you can use those DMI lines +DI and -DI along with ADX’s most current value to come up with potential representations of strong versus weak trends. An ADX above 25 is usually a sign of a very strong trending market; an ADX below 20 indicates that the market is trending sideways, producing more false signals than actual trend trading signals.
Trading Applications
Signal types
In the world of trading, many traders using DMI as an element or component in their trading strategies use DMI to filter their trading strategies and ensure that they are trading with the prevailing momentum of the overall market conditions. Crossovers of the DMI lines (+DI crossover above -DI for buy signal), along with the current position of ADX trending upward, will generate the main buy and sell signals; conversely (-DI crossover above +DI for sell signal). Experienced traders at this point will be looking for confirmation that the buying/selling trend has momentum prior to entering or exiting positions, so they generally wait until the slope of the ADX line turns positive before moving into or out of their positions.
Implementation strategies
Additionally, when evaluating trend strength relative to price, you can also observe divergences between price trends and DMI trends. The price of an asset can be reaching record highs however if the Average Directional Movement Index (DMI) is failing that means the trend has likely exhausted itself. DMI shows traders if the price trend continues to show good support through volume and momentum thus allowing the trader to potentially stay in a winning position longer than they might if they had exited a winning trade when a small price retracement occurred.
Risk management
No technical analysis tool is 100% certain therefore DMI is a lagging indicator and requires strict risk management principles. Use the Average True Range (ATR) as your stop-loss when placing trades in order to limit your financial risk associated with market volatility from minor price fluctuations.
Limitations Analysis
False signal risks
In a sideways market, the DMI +DI and -DI can frequently crossover without any significant price movement resulting in "whipsaw" trades.
Market conditions
The DMI trend indicator functions effectively in a trending market; however, it does have limitations. Knowing the DMI limitations can help maximize your overall performance in the long run.
Signal validation
To confirm whether or not an asset is in a trending market, use the Average Directional Movement Index (ADX) as a primary measure. For best results, utilize the ADX as a measurement of any true signal to eliminate false signals.
Risk mitigation
Due to its basis on historical price action, DMI can have a delayed effect on identifying trend strength from unexpected news driven changes in the trend direction.
Integration Strategies
Complementary indicators
Utilizing DMI in combination with other forms of technical analysis creates a complete trading system. In particular, DMI works great in tandem with Complementary Indicators. Combining the DMI and the Relative Strength Index (RSI) will help you determine both the strength of trends and whether the market is overbought/oversold. Moving averages particularly the 200 period EMA, can also be used to verify that you are trading in line with the long-term trend.
Period adjustments
If you are trading in the normal range of 14 periods, the DMI settings will be sufficient for the majority of the trading activity. However, if you are using shorter-term trading, you can adjust your DMI setting to a lower number of periods (i.e., 10) to make it more responsive, but the risk of receiving false trade signals will be greater.
Confirmation methods
Wait for the positive directional movement candle to close above the recent resistance level prior to taking a trade that the DMI has signaled. By using this method to confirm the direction and strength, you will receive one of your forms of actual price action support.
Implementation techniques
When implementing DMI within a broader trading system, use it primarily as a filter rather than a standalone signal generator. For example, only take RSI overbought/oversold signals when ADX confirms a trending environment — this significantly reduces false entries in choppy markets.
Advanced Applications
Market analysis
Professional traders generally compute DMI across multiple time frames. For example, a strong trend on a daily chart may create opportunities for you to find high probability entry points on a 4 hour chart.
Strategy development
By analyzing multiple timeframes, you ensure that you do not go against the "big picture" trend direction, thereby assisting with strategy development.
Performance optimization
Used with discipline and combined with sound risk management, the DMI transforms raw price data into actionable insight — helping traders stay in winning trends longer and avoid the noise of directionless markets.
Risk control
Advanced risk control involves using the Average True Range (ATR) for volatility-based stop-loss levels and avoiding taking trades when ADX is below 20.
Conclusion
The Directional Movement Index (DMI) is a must-have technical analysis tool for any trader that wishes to master both the strong and weak trends. The combination of the two directional components (+DI / -DI) and average directional index (ADX) gives you the complete picture regarding the direction that price will move. While it may take time to become proficient with the DMI, trading with the DMI can substantially enhance your ability to capture larger moves in the market while avoiding stagnant market traps.
FAQs
How to identify reliable DMI trading signals? Examples of how to identify reliable DMI trading signals: Look for crossovers of the +DI and -DI that happen when ADX is gaining momentum above 25. This indicates that the momentum of the direction of the trend is increasing.
What timeframes work best with DMI analysis? DMI can work across all time frames, but daily or weekly charts are the best for determining strong trends. Lower time frames will give more signals, but they may also have more false signals.
How to combine DMI with other technical indicators? The DMI can be used in combination with RSI or moving averages to develop exhaustion or confirm the long-term trend direction and strength.
What are the best risk management strategies for DMI trading? Use the Average True Range (ATR) for volatility-based stop-loss levels. Avoid taking trades when ADX is below 20.
How to adjust DMI parameters for different market conditions? If you are trading in the normal range of 14 periods, the DMI settings will be sufficient for the majority of the trading activity. However, if you are using shorter-term trading, you can adjust your DMI setting to a lower number of periods (i.e., 10) to make it more responsive, but the risk of receiving false trade signals will be greater.
Want to learn more about crypto arbitrage?
Get a subscription and access the best tool on the market for arbitrage on Spot, Futures, CEX, and DEX exchanges.

You might be interested

Understanding Cryptocurrency Mining

Cryptocurrency Day Trading

Top 6 Security Vulnerabilities in Blockchain
