Understanding Fibonacci Trading in Cryptocurrency


with ArbitrageScanner!
Cryptocurrency trading - this is not only research, but also modeling of where the exchange is moving. Right here in support comes Fibonacci retracement - a mechanism that detects secret degrees of help and resistance, turning them into major trading points. Beautifully curious? Learn from our newest article how to correctly apply the Fibonacci retracement in order to increase the reliability of making conclusions and increase profits.
What is a Fibonacci retracement?
The Fibonacci retracement is a well-known pointer in the industry that can help traders to identify possible reversal points in the value of an asset. Derived from the Fibonacci sequence, this tool uses key degrees to predict where price corrections are likely to occur during the current trend.
These degrees are important because they often indicate areas where the price may pause, open or consolidate, primarily in comparison to extending a move in the initial direction. By using the Fibonacci retracement degrees to the price chart, traders have a good chance of establishing likely areas of help and resistance, which can help them make the most informed trading decisions.
How do Fibonacci retracements work?
Fibonacci retracements are utilized by the line of execution of horizontal directions in a price chart. First, two key points are selected: the place of maximum and the place of minimum quantity within the trend. Then the Fibonacci tool calculates the degrees of correction between these two points. These degrees imply possible price areas, where the cost is able to stabilize or open.
But these degrees are not considered guaranteed turning points, but are intended for the purpose of traders to guide the presence of planning possible entry and exit points. Fibonacci degrees often emphasize dangerous areas of resistance or support, which have all chances to be introduced into the trading strategy. The importance of these degrees can be maximized by combining them with other trading indicators.
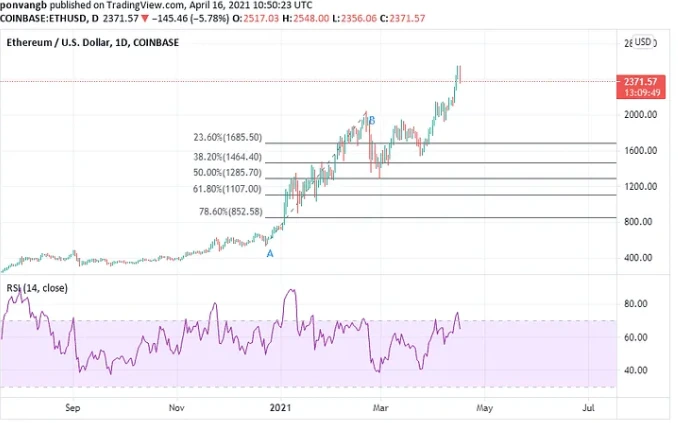
Rate directions can help to assess a single market direction, while moving averages, such as the 50-day SMA (moving average), provide an auxiliary understanding of possible areas of support or opposition. The Relative Strength Indicator (RSI) is also considered a significant trading indicator, as it shows whether an asset is bought or oversold in the Fibonacci degree.
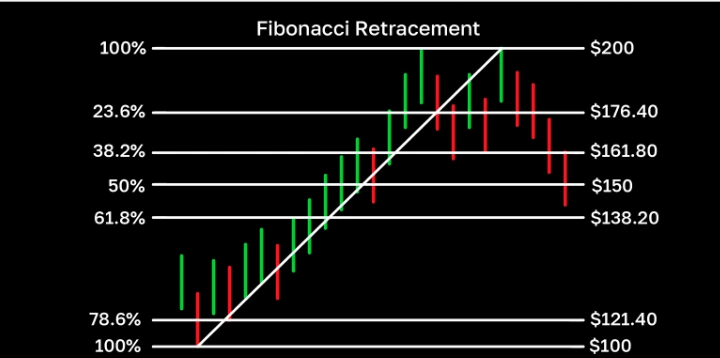
Fibonacci levels
The key Fibonacci levels used in cryptocurrency trading are 23.6%, 38.2%, 50%, 61.8% and 78.6%. These degrees imply a share of the value movement, which is able to be broken off until the trend continues.
Here is a description of each level:
-
23.6%: A slight retracement, often indicating a minor pullback in value before trend recovery.
-
38.2%: The deepest retracement, where the value is able to pause or open up before continuing its original direction.
-
50%: Although not technically considered a component of the Fibonacci sequence, the degree of 50% is widely used, as it implies a mediocre place of price movement, often demonstrating a powerful psychological level.
-
61.8%: Known as the “Golden Ratio”, this degree is considered one of the more significant degrees of Fibonacci, often coming as a strong support or resistance.
-
78.6%: A deep retracement level, which indicates a significant correction, probably signaling a reversal or continuation of the trend.
Traders use these degrees in order to establish where the cost is able to correct, first of all, than to continue its original trend.
How to use Fibonacci in crypto trading?
Fibonacci tools are widely used by crypto traders in order to consider price trends and patterns, as well as to reveal possible trading opportunities. But these are not magic formulas that provide results in any trade. They are simply tools that can help you make informed decisions based on historical data and human psychology.
Here are some tips on how to use Fibonacci in cryptocurrency trading:
-
Use Fibonacci tools in combination with other instruments and indicators of technological consideration, such as trend directions, moving average, size, RSI, MACD, etc. This can help you to prove the results of the consideration and increase the decisiveness in your own trades.
-
Use Fibonacci tools in different time frames, for example, in daily, hourly or short-term charts. This can help you to detect various trends and patterns in different magnitudes and adjust your trading strategy accordingly.
-
Use Fibonacci tools together with caution and caution. Do not be reckless with Fibonacci degrees without taking into account other conditions such as market sentiment, news, fundamentals, etc. Do not forget the Fibonacci instruments - this is not a clear discipline, but rather advice that may or may not work in every situation.
-
Use Fibonacci instruments together with appropriate risk management. Do not risk more than you can give yourself the opportunity to lose, and constantly put a stop-loss and profit before entering the transaction. Be flexible and adaptable to changing market circumstances and do not allow emotions to cloud your judgment.
Examples of using Fibonacci retracement in cryptocurrency trading
Fibonacci retracement levels are used extensively in cryptocurrency trading in order to establish possible bands of help and opposition, allowing traders to make reasoned entry and exit decisions. These degrees are particularly significant in circumstances of trading volatility, which are often encountered in the cryptocurrency space. See certain methods of applying the Fibonacci retracement.
Determining help and resistance
Fibonacci retracement levels can help traders identify possible areas where the value can find help or resistance during a pullback. The more commonly used levels are 23.6%, 38.2%, 50%, 61.8% and 78.6%. For example, if bitcoin rises from $30,000 to $40,000, a pullback to the 38.2% degree will occur at approximately $36,180. Traders often carefully observe these degrees, so as they have all the chances to mention in which place the influence in acquisition or realization is able to increase, that will turn to possible reversals.
Entry and exit points
Traders often use Fibonacci degrees in order to establish the best entry and exit points. For example, during a period of upward rate changes, the trader is able to buy if the cost goes to the degrees of 38.2% or 61.8%, waiting for a rebound. Conversely, in the presence of a downtrend, traders can realize or set short views if the value moves to these degrees. A lot of significant information demonstrates that numerous cryptocurrencies show value action similar to Fibonacci degrees, which makes them a popular technical analysis tool.
Stop loss orders
Fibonacci levels also have the potential to assist traders in placing stop loss orders. By placing stop-loss orders slightly beyond the major Fibonacci levels, traders have a chance to protect their principal capital in case the value continues to decline and does not fall back. For example, in case a trader acquires a 61.8% correction, he or she is able to set a stop loss a little further than the 78.6% level in order to reduce the probable losses. This policy can help traders to maintain composure and manage risk productively.
Risk Management
The use of Fibonacci retracements allows traders to manage risk in the most productive way. By realizing where possible reversals may occur, traders can make more informed decisions regarding their positions. For example, if a trader identifies a powerful 38.2% assistance rate, someone is able to increase the volume of his own view, realizing that the risk of a significant drop further. This aspect is able to increase the overall efficiency of trading and reduce the sensitivity of the conclusions taken.
Market psychology
The popularity of Fibonacci adjustment degrees among traders is capable of forming self-fulfilling predictions. Numerous traders observe because of the same and the same degrees, which leads to an increase in the initiative of buying and selling at these points. This manifestation is able to increase the movement of value, as traders pay attention to the same and these same industrial signals. For example, if a large number of traders place orders to buy in the degree of adjustment 61.8%, in this case, the emerging pressure of buyers is able to cause a rebound in price, exacerbating the validity of Fibonacci levels.
Limitations and further considerations
Fibonacci retracement levels are a well-known mechanism, but none are considered accurate and have their own limits. Probably the biggest challenge is the individuality of the presence of the selection of points of doubt, as different traders prefer different places of maximum and minimum quantity, which leads to the emergence of contradictory degrees of correction.
In addition, the degrees of Fibonacci retracement modeling are not too large. The values have all chances to break through the degrees, but not to open as expected. In addition, their effectiveness depends on the bazaar circumstances, as they generally work better in trend bazaars and are most unreliable in conditions of instability.
In addition, there is a possibility of false signals and breakouts, if the cost in a short period of time breaks the Fibonacci degree, and then does not stop moving in the opposite direction. This can be the reason for premature triggering of stop-loss and poor execution of the operation. If a number of adjustment degrees are grouped close to each other, the values have all chances to respond unpredictably, initiating confusion.
There is also confirmation bias, which appears if traders overlay Fibonacci levels in their own charts, presenting only then, which confirms their idea.
Conclusion
Fibonacci retracement has proven to be an essential mechanism for cryptocurrency traders who are eager to understand the unexpected waters of this rapidly changing trade. The perception and use of this exact amazing thing makes it possible to discover secret patterns, predict possible reversals and make the most reasoned decisions in their own trading endeavors.
Just as I have previously discovered in this guide, the influence of the Fibonacci retracement lies in its ability to combine the beauty of arithmetic with the practicality of real trading strategies. Fibonacci retracements are the only one of the most versatile devices for the purpose of every crypto trader in order to establish entry and exit degrees.
Having mastered this technique, you can more thoroughly realize the connection between quantities and bazaars and increase your own skills in trading cryptocurrencies to the newest height. But retracements in no way possess a 100% probability of effective operation. For this reason, constantly confirm their authenticity in two together with other correct industry indicators or candlestick patterns.
FAQ
How to apply Fibonacci retracement in cryptocurrency?
In order to apply Fibonacci retracement in cryptocurrency, establish significant price swings, use the Fibonacci mechanism to erect major degrees and analyze the price impact around these degrees in the object of possible help and opposition.
What is 0.618 in trading?
The 0.618 degree in trading implies the main degree of Fibonacci adjustment, often referred to as the “golden ratio”. It is of great importance as it often speaks to possible reversal points in price movements, guiding traders in their strategies.
What are the best Fibonacci levels for cryptocurrencies in general?
The best Fibonacci levels for the purpose of trading cryptocurrencies are 23.6%, 38.2%, 50%, 61.8% and 100%. These degrees are intended as possible zones of help and resistance, helping traders to establish entry and exit points in the presence of value movement.
How to find entry and exit points in cryptocurrency?
In order to find entry and exit points in cryptocurrency, traders watch the value move around key Fibonacci ratios. They often enter big views at the 38.2% or 50% degrees of adjustment and set targets according to gains at the most significant levels, such as 61.8%.
Want to learn more about crypto arbitrage?
Get a subscription and access the best tool on the market for arbitrage on Spot, Futures, CEX, and DEX exchanges.

You might be interested

Understanding Trading Volume in Cryptocurrency Markets

Understanding and Trading Falling Knives in Cryptocurrency
Understanding Limit Orders in Cryptocurrency Trading

Crypto Bull Market Guide: How to Spot and Trade the Bulls
