Crypto Fear and Greed Index: How to Understand and Use It


with ArbitrageScanner!
What is the Crypto Market Fear and Greed Index
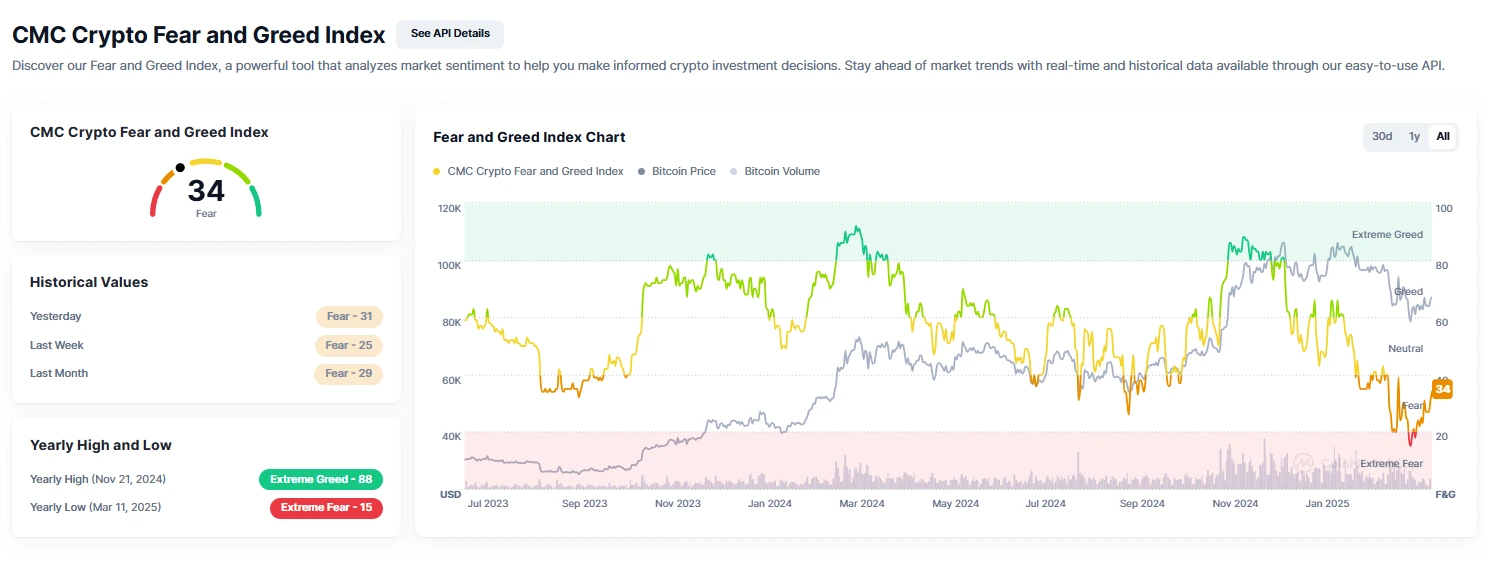
The cryptocurrency market Fear and Greed Index is an analytical tool that allows for determining the prevailing sentiment of market participants. It is measured on a scale from 0 to 100, where 0 indicates a state of extreme fear and 100 signals excessive greed.
By using the index, one can assess whether market participants are experiencing uncertainty and panic or, conversely, showing excessive optimism, which may signal a potential trend reversal.
History of the Index
The index was developed by the Alternative.me platform to provide a simple tool for assessing sentiment in the cryptocurrency market. It initially focused on Bitcoin, given its dominant position, but over time it has expanded to cover other major cryptocurrencies.
Market Psychology: Investor Fear and Greed
The cryptocurrency market is subject to intense emotional fluctuations. During periods of rising prices, investors can become overly greedy, fearing they might miss out on profits (FOMO). Conversely, when the market falls, fear can lead to panic selling. The index seeks to quantify these emotions, helping to avoid irrational decisions.
How the Fear and Greed Index Works
The data is updated daily and is formed based on an analysis of the following factors:
-
Volatility (25%) – evaluates Bitcoin price changes over the last 30 and 90 days. High volatility indicates an increased level of fear among investors, while stability points to a calm market situation;
-
Market Momentum/Volume (25%) – measures market data and compares it with average values over the last 30/90 days, after which these two values are combined;
-
Social Media (15%) – the index can analyze market-related keywords on Reddit and Twitter to check how users are interacting with Bitcoin. The team notes that this feature is still in the experimental stage and they are optimizing its performance;
-
Surveys (15%) – using strawpoll.com, a large platform for public polls, weekly surveys are conducted on how people view and perceive the crypto market. Currently, this metric is paused as the team believes these results should not be given too much weight;
-
Dominance (10%) – a coin's dominance is similar to the market capitalization share of the entire crypto market. A rise in Bitcoin dominance is often caused by fear, as it is a "safe haven" for crypto investors; when Bitcoin dominance decreases, people become more confident and, therefore, greedy and ready to speculate on smaller altcoins seeking higher returns, as many altcoins can outperform Bitcoin in the short term;
-
Trends (10%) – the index extracts data from Google Trends: which cryptocurrency and Bitcoin-related queries are currently most relevant.
Thanks to each of the presented criteria, the index reflects the overall market mood, showing current market sentiments.
Interpreting Index Values
The index scale is divided into several categories:
-
0-24 – extreme fear: market participants are indecisive, which may present a buying opportunity;
-
25-49 – fear: a moderate level of anxiety is present in the market;
-
50-74 – greed: investors are becoming more confident and prone to risk;
-
75-100 – extreme greed: excessive optimism, potential asset overvaluation, and risk of price correction;
Application in Trading
The index can serve as a supporting tool when making trading decisions:
-
Contrarian investing. Buying during periods of extreme fear and selling during extreme greed can be a profitable strategy;
-
Long-term strategies. Using the index to identify optimal market entry and exit points in accordance with long-term goals;
-
Short-term strategies. Based on index data, market participants can make decisions based on short-term fluctuations.
Index Limitations
Despite its usefulness, the index has its limitations:
-
False signals. The index is based on historical data and may not account for sudden market events;
-
Correlation with other indicators. The index should be used in conjunction with other indicators and trading data to obtain a more complete picture of the market.
Comparison with Other Market Indicators
The Fear and Greed Index complements other analysis methods:
-
Technical analysis. The index can confirm or refute signals obtained through technical analysis;
-
Oscillators and other sentiment indices. Comparing indicators can help identify more accurate entry and exit points.
Practical Examples of Using the Index
-
Market crashes. During periods of sharp index drops to extreme fear levels, investors using contrarian strategies could find lucrative buying opportunities;
-
Bull markets. When the index reaches extreme greed levels, traders could consider the possibility of taking profits before a potential correction.
Index for Different Cryptocurrencies
While the index initially focused on Bitcoin, versions exist for other cryptocurrencies:
-
Bitcoin vs. Altcoins. Indices for various cryptocurrencies may differ depending on the specifics of each asset;
-
Specific indices for different market sectors. Developing indices for specific sectors like DeFi can provide more accurate data.
Tools for Tracking the Index
Several resources exist for monitoring the index:
-
Popular web resources. Alternative.me, CoinGecko, and CoinMarketCap – these platforms update data daily and show historical information;
-
Mobile apps and notifications. Some cryptocurrency mobile apps offer built-in tools for tracking the index and can send notifications when extreme values are reached, which is convenient for prompt decision-making.
Frequently Asked Questions (FAQ)
What is the range of the index data?
The index varies from 0 (extreme fear) to 100 (extreme greed). During moments of strong market volatility, index values can be seen at their maximum points.
What is the update frequency of the index?
Data updates occur every 24 hours.
Can the index predict a market crash?
No, but it can help identify when the market is severely overheated (extreme greed) or when a reversal is brewing (extreme fear).
Conclusion
The Fear and Greed Index helps investors and traders correctly identify market sentiment. It should be used as an additional, not primary, indicator for determining optimal entry and exit points, especially in combination with technical and fundamental analysis.
However, it is important to remember that the index does not guarantee accurate forecasts and can issue false signals. Therefore, it is best applied within a comprehensive approach to market analysis, for example, in conjunction with on-chain activity analysis available in the Arbitrage Scanner subscription, rather than as the sole source of information for trading decisions.
Want to learn more about crypto arbitrage?
Get a subscription and access the best tool on the market for arbitrage on Spot, Futures, CEX, and DEX exchanges.

You might be interested

FOMO — What is it and how to avoid the Fear of Missing Out syndrome?
The best indicators for cryptocurrency trading in 2024
