The Inverted Hammer Candlestick Pattern

with ArbitrageScanner!
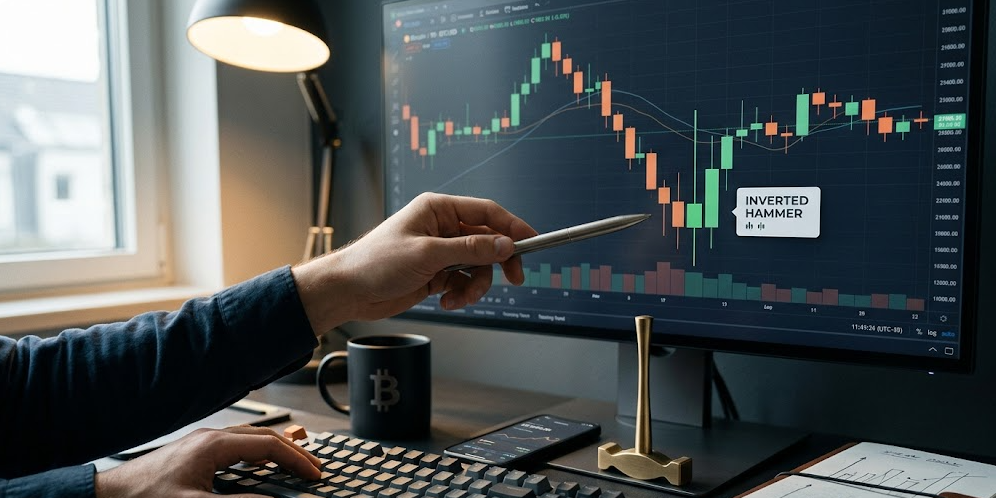
Identifying the moment when a trend loses steam and a reversal occurs in the volatile and turbulent marketplaces of stocks and cryptocurrencies is one of the most important objectives. One of the most recognized and important reversals of the trend is represented by an Inverted Hammer equity candle. For technical analysis in most instances when an Inverted Hammer has developed on the price chart, it signifies to traders the potential end of a continuing bear trend and possible future Bull reversal pattern. As a result, it is particularly important for traders looking to utilize the Inverted Hammer should learn this candle's specific features in detail.
Description of the Inverted Hammer
The Inverted Hammer is a unique candle structure that stands out to the trader because of how it is constructed. To help ensure proper identification of an Inverted Hammer, traders must be conscious of three common characteristics associated with this candle.
Small Body
The body of the Inverted Hammer is classified as a small body relative to the long upper shadow. For example, the body of the Inverted Hammer represents the distance from the open price to the close price, for the trading period in which the single candle has formed. The body of a candle in an Inverted Hammer pattern will be located at the extreme bottom end of the range of the candle. An Inverted Hammer's body will either be large or small, but what is important is that it is located at the bottom end of the candle's overall range.
Very Long Upper Shadow
However, for the Inverted Hammer candle, the most important feature is having a very long upper shadow (wick) that is at least twice the height of the small real body. This significant increase in value demonstrates that while buyers were able to raise the price to an extraordinary amount at the end of this session, ultimately one would still be unable to hold those gains until the end of the day.
Perfect Conditions for the Formation of a Valid Inverted Hammer
A valid upside-down hammer would consist of little or no lower shadow. If there is a lower shadow, it should not be substantially longer than the body itself. The best way to visualize this condition is by means of a 2 to 1 ratio, with the body being half as long as the upper shadow.
Color of the Inverted Hammer and Consequential Strength of the Candle
Traders frequently inquire as to whether a green inverted hammer is more effective than a red inverted hammer. Although both green inverted hammers and red inverted hammers are considered bullish reversal patterns, it can be said from the sound of the phrases that they possess the same power; for instance, an inverted hammer having closed above the opening produces an additional corresponding strength to the overall candle.
Recognizing the Perfect Inverted Hammer Set-up
In technical analysis, context is critical. An isolated candlestick with a short body holds no implications for reversal unless it exists in a broad context, thus establishing a valid condition for reversal.
Need for Previous Downward Price Context
An inverted hammer is only considered to represent reversal if it occurs at the bottom of a sell-off. The inverted hammer is representative of the "selling exhaustion." Therefore, if the market has been trending down consistently prior to the observation of the inverted hammer, then a reversal is suggested by this inverted hammer candlestick pattern.
How to Assess Volume When Validating Inverted Hammer Patterns
The stronger an inverted hammer candlestick appears (higher volume on the day it printed than on previous days), the more significance it holds as an indicator of a market climactic bottom (think back to the "climax" or "shakeout" phases) and the more shares or coins will have changed hands from weak to strong hands.
The Differences Between Red and Green Inverted Hammer Patterns
An inverted hammer candlestick that closes lower than it opened (red) shows that the bulls attempted to gain control but the bears were able to force the close below the open. This suggests it does represent a possible bullish reversal, but like an inverted hammer candlestick (green), it needs to be confirmed properly and more conservatively.
Differences Between Inverted Hammer Patterns and Other Similar Patterns
While inverted hammers and shooting stars look the same, (the only real difference is where they occur), the former is a bullish reversal that develops at the end of a downtrend while the latter is a bearish reversal that occurs at the top of an uptrend.
Inverted Hammer Market Psychology
Besides merely being represented by lines on charts, the inverted hammer also tells a story of market psychology (buyer/seller) and how institutional activity shapes the market's view over time.
Shifting from Bearish to Bullish Sentiment in the Market
A series of bearish candles followed by an inverted hammer means that the market has recently shifted from a state of bearish sentiment into a state of bullish sentiment. The long upper shadow indicates that the bulls have regained control of the market, successfully pushing back against the bears' selling pressure.
The long upper shadow also indicates that the bulls have been able to accumulate more buying power after an extended period of declining prices. Therefore, there is increasing evidence of buyer interest at current prices.
The closing price is a sign of strength. A closing price that is higher than the initial opening price suggests that selling pressure is decreasing, and sellers cannot maintain the price of the stock at its lowest point.
The inverted hammer is a bullish signal. It shows that there has been aggressive buying from the bulls, who are now beginning to gain control of the virtual currency market.
Confirmation Strategies for the Inverted Hammer
Traders need to be cautious when using a single candlestick for establishing a position. A professional trader will wait for additional confirmation before risking their capital.
The Crucial Next-Day Candle
A bullish candle should immediately follow an inverted hammer. At this point, traders will look for confirmation of the bullish trend by waiting for the next session to close above the previously established inverted hammer. A strong bullish candle that follows the current candle would confirm the signal.
Support Level Interactions
The reliability of a pattern increases exponentially if it occurs on a historical support level or Fibonacci retracement, and/or a psychological "round number" (e.g., Bitcoin at $50,000).
Trendline Breakouts as Validation
The inverted hammer's occurrence with a break of a bearish trendline gives you "double confirmation" of the transition from bearish to bullish structural bias.
Volume Expansion as Confirmation
A further indication of confirmation is followed by the volume expansion of the inverted hammer. If a subsequent green candle with higher volume follows the inverted hammer candle, it's a sign that "smart money," or institutional buyers, is entering the market.
Practical Trading Approaches with Inverted Hammers
Understanding the mechanics of how the inverted hammer functions is only a portion of the battle; effectively trading it is where the profit is generated. Successful use of the inverted hammer requires having a comprehensive entry and exit plan.
- Entry Point: A common practice is to place a buy order slightly above the high of the inverted hammer's upper shadow and take entry when the price breaks above this level in the following session.
- Stop-Loss: Place your stop-loss just below the inverted hammer's low. If the price moves below (or "triggers") this stop-loss level, the reversal signal has failed.
- Profit Target: Use the next overhead resistance level or a fixed risk/reward ratio (1:2 ratio). Indicators other than the Inverted Hammer can provide better reliability for your trades — here’s how.
Enhancing Inverted Hammer Reliability with Other Indicators
If you are using the inverted hammer pattern to trade, you are probably aware that no candlestick pattern should be traded in isolation, or that you should have a confluence of indicators when trading.
Momentum indicators can confirm the timing and validity of the purchase. As an example, if the inverted hammer pattern forms at a time when the RSI value is less than 30 (which indicates that the instrument is oversold), it is statistically more likely to bounce back than if it was developed while the RSI value is in the range of 30 to 70.
If the price of the instrument had been consistently trading below the 200-day moving average prior to forming an inverted hammer, there would be evidence to suggest that this is a mean reversion trade.
Common Mistakes When Trading the Inverted Hammer
The majority of retail traders who use the inverted hammer candles to trade lose money because they mistakenly assume that all inverted hammers signal a purchase. Primary reasons retail investors/purchasers make mistakes include the following:
- They trade in a vacuum; always assess the total trend before purchasing an inverted hammer candle for your trade.
- They do not properly recognize the previous direction of the market trend prior to purchasing an inverted hammer candle. An inverted hammer pattern must have a previous downward trend before it can legitimately be considered an inverted hammer, otherwise it may just simply be noise that cannot be treated like a legitimate inverted hammer pattern.
- Many retail traders fail to wait until confirmation before they make an entry into the market because the inverted hammer candle is the first and therefore most obvious indicator of entry into a trade. This also results in many retail traders losing lots of money trading CFDs.
The Bottom Line
The inverted hammer is an excellent example of a flat or price transition to a new trend or price direction. By analyzing all indicators combined with the inverted hammer candlestick then layering confirmation with sound risk control, a trader can enhance his ability to determine the high probability turning point for stock trading and cryptocurrency trading.
FAQs
How does the Inverted Hammer perform in Crypto vs. Stock?
The price action of an inverted hammer is generally more volatile in crypto than in stock. Since crypto is traded 24/7 and many people trade it, the reversal tends to be more aggressive; however, you also increase your chances of losing money on "fakeout" trades because crypto is less liquid than stocks.
What is the historical record for the Inverted Hammer success rate in predicting an upward reversal?
In general, while no candlestick pattern will be 100% accurate, the inverted hammer has a decent success rate of about 60%-65% when it is confirmed with high volume and followed by a bullish candlestick. The inverted hammer is far less likely to be accurate if it is used alone.
What does the size of the upper shadow have to do with the signal of an inverted hammer being a reliable signal?
Typically, the longer the upper shadow, the more significant the rejection of higher prices and increased buying pressure. But if the upper shadow is exceptionally long (4-5X the body), there is a good chance that the "spike" up is a fluke, not a shift in the market's buying sentiment.
What time frames are better suited for trading the inverted hammer in the crypto market?
The inverted hammer design is most valid on longer time frames (daily and 4-hour charts); on lower time frames (1-minute and 5-minute charts), the inverted hammer pattern more often constitutes market noise and leads to multiple false signals.
How do you differentiate between a valid inverted hammer reversal signal from just a brief pause in a continuing downtrend?
The key to identifying a valid reversal is to look for confirmation. A valid reversal will have a strong follow-up candlestick that is bullish and closes above the high of the inverted hammer's shadow; if the price continues to consolidate around the high of the inverted hammer's shadow or can't break above the high of the inverted hammer, it is most likely just a "bear flag" but not a true reversal.
Want to learn more about crypto arbitrage?
Get a subscription and access the best tool on the market for arbitrage on Spot, Futures, CEX, and DEX exchanges.

You might be interested
Understanding Cryptocurrency Trading
How to Send Trades From TradingView to Your Trading Bot

Calculating Cryptocurrency Profits
