RSI Trading Strategy Guide: Crypto Technical Analysis

with ArbitrageScanner!
RSI Trading Strategy Guide: Technical Analysis for Crypto Trading
When entering the financial markets, a novice trader faces a rather difficult task: what indicators to choose for successful trading? There are many of them on the market today, and if a person has no experience, it is extremely problematic to understand which ones to start with. One of the basic indicators that help to form a “market picture” is RSI (Relative Strength Index).
With its help, traders can determine whether an asset is overbought or oversold, and thanks to this information they can adjust their trading strategy to the market mood.
In this article we will analyze in detail what RSI is, how to use it, as well as the pros and cons of the indicator.
Basic Definition
RSI (Relative Strength Index) measures the strength of a price movement, which helps traders determine:
-
Whether an asset is overbought or oversold;
-
Potential trend change;
-
Identify divergences between the price and the indicator;
-
Detect key support and resistance levels;
-
Confirm signals from other indicators.
RSI values range from 0 to 100, where:
-
Levels of 70 and above are considered an overbought zone;
-
Levels of 30 and below indicate oversold.
Calculation methods
-
Period selection. Standardly traders are offered to calculate RSI for 14 days, but in the cryptocurrency market this period is reduced to 7 or 9 days, due to high volatility, to get more accurate information;
-
Calculation of average values. For each period, the average rise and average fall in price is calculated.
-
Application of the formula. Based on the obtained data, the RSI value is calculated.
RSI components
Indicator settings
When using the indicator, it is extremely important to select the following parameters correctly:
-
Period. The larger it is, the smoother the data will be, but less informative, from which the result may suffer;
-
Signal levels. Classic levels are 30 and 70, but some traders use extended limits (for example, 20 and 80). On the one hand, it adds additional interpretation of the received information, on the other hand, it is not always useful to depart from the standard.
Time periods
The choice of time period depends on the trading style:
-
For scalping: 5-15 minutes;
-
For medium-term trading: hourly or daily charts;
-
For long-term investments: weekly or monthly data.
Adjustment of parameters
Traders can adjust RSI parameters depending on market conditions. For example, it is in strong trend conditions that the overbought and oversold levels can be shifted to 80 and 20 respectively.
Trading strategies
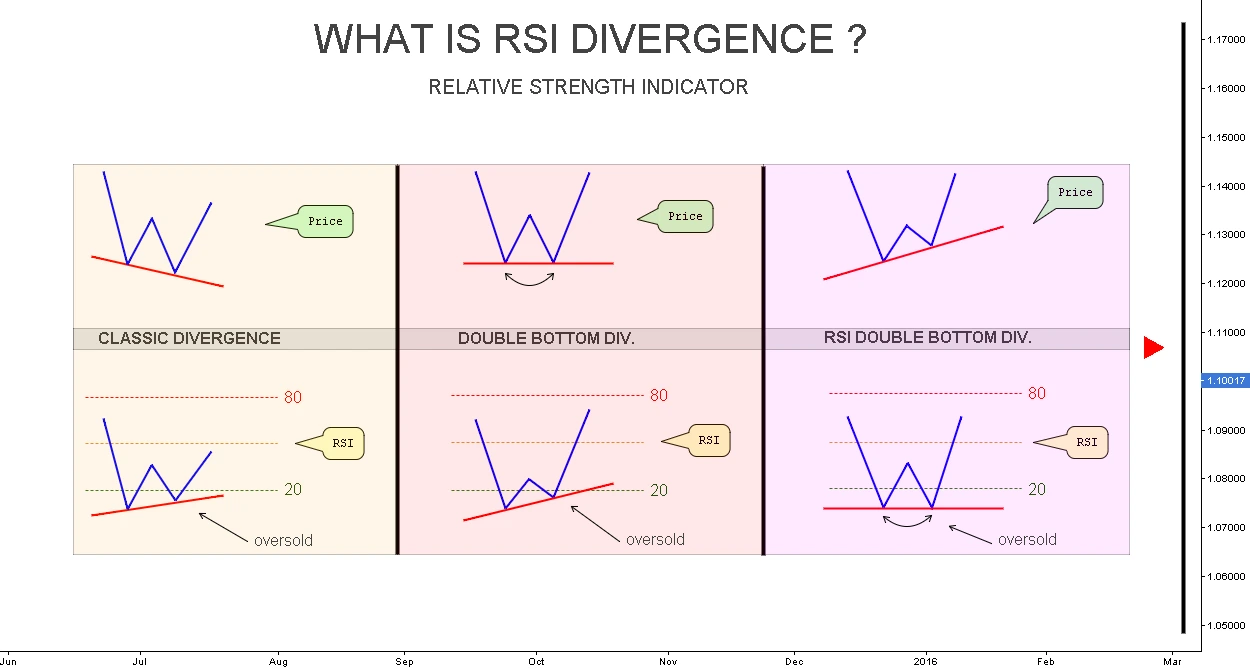
RSI Divergence
One of the most reliable signals for a trend reversal: when the price is moving in one direction, but the indicator shows the opposite trend. For example: if the price is making new highs and the RSI has not even reached the previous highs, it indicates that the current uptrend is weak and a reversal is possible at any moment.
Overbought/Oversold
When the RSI is above 70, the asset is considered overbought, and below 30, it is considered oversold. However, it is important to remember that overbought does not always mean an immediate drop in price, while oversold means a rise. It is always better to use the data obtained with information from other indicators to confirm the theory. Example of indicators: trading volume or moving average.
Advancing through the 50 level
The 50 level in RSI is considered neutral, but crossing it in any direction also gives traders information:
-
A crossing above 50 is a potential buy signal;
-
A move below 50 is a sell signal.
Combined approaches
As already mentioned, RSI is better used in conjunction with other indicators, namely:
-
Moving Average. Confirms the direction of the main trend;
-
Fibonacci levels. Help to identify correction targets;
-
Trading volumes. Confirm the strength of breakouts.
There are other indicators, but judging by the feedback of traders on the web, RSI combines with this one best of all.
Practical application
Reading signals
Before you start working with RSI, you need to learn how to correctly interpret the information that the indicator provides:
-
Overbought zone starts from the level of 70 and above - you can open a sell position;
-
Oversold zone starts from the level of 30 and below - you can open a buy position;
-
Divergence (the principle is described above) - a signal of trend reversal, it is time to rebuild the trading strategy;
-
Overcoming the level of 50 in any direction - the beginning of a new trend.
Entry/exit points
-
Entry. When RSI reaches the oversold level (30) or at divergence;
-
Exit. When RSI reaches the overbought level (70) or when opposite signals appear.
It is better to adhere to these rules when trading, because RSI has been used for a long time and all patterns in it have long been identified. If it seems to you that the indicator does not correctly provide information for entry or exit points, then reconfigure it for other periods and recheck the result.
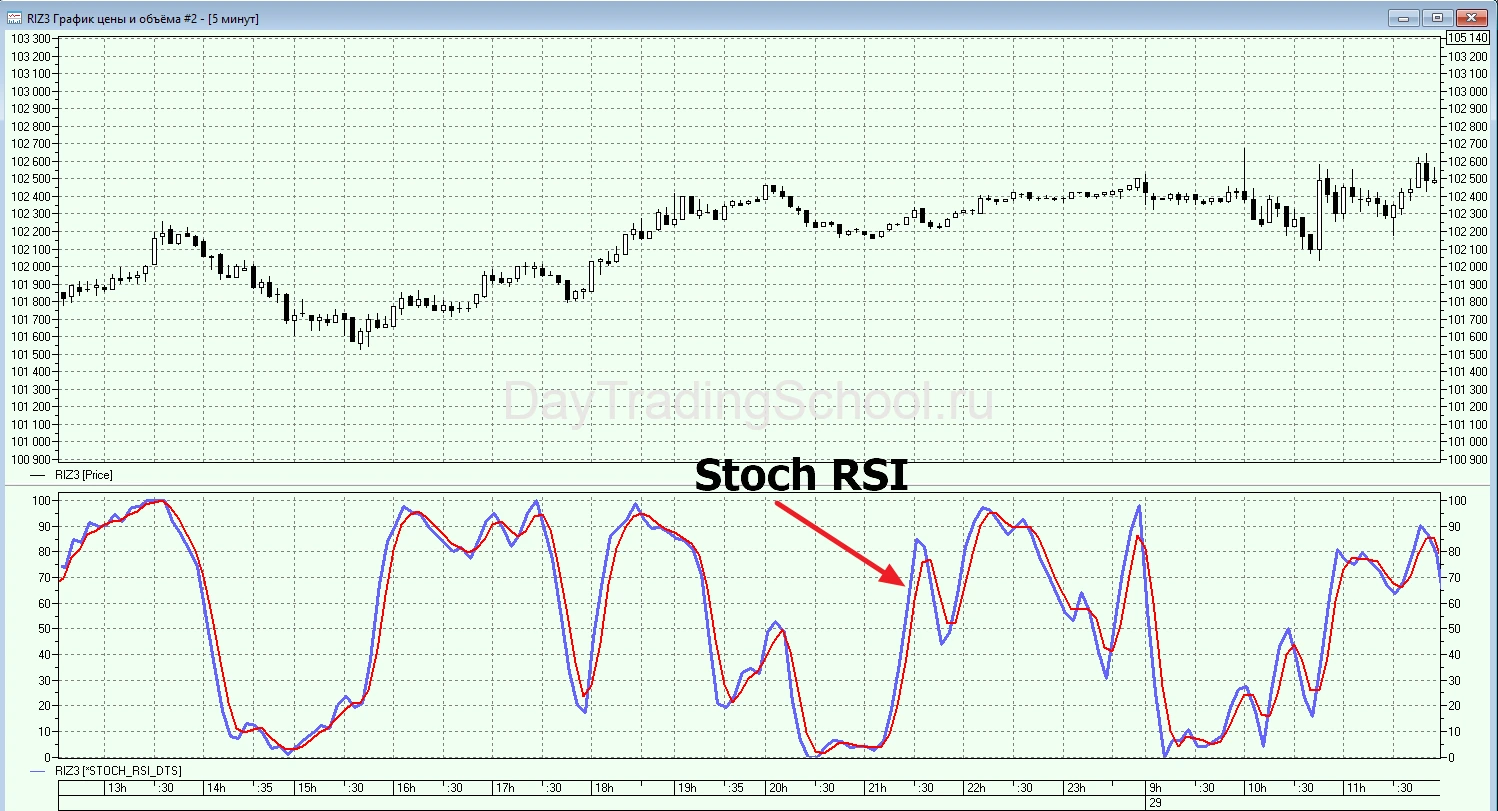
Definition
Stochastic RSI, or simply StochRSI, is a technical analysis indicator that is used to determine whether an asset is overbought or oversold and to identify current market trends. As the name suggests, StochRSI is derived from the Standard Relative Strength Index (RSI) and is thus considered an indicator of an indicator. It is an oscillator type, meaning it oscillates above and below the center line.
Differences from RSI
-
StochRSI gives a narrow range of levels: the indicator oscillates around the center line (0.5) between 0 and 1;
-
The number of signals generated by StochRSI is higher than RSI because of its faster response to price changes.
Usage Scenarios
-
The indicator is primarily used to identify potential entry and exit points and price reversals. A value of 0.2 or below indicates that the asset is likely oversold, while a value of 0.8 or above indicates that it is likely overbought;
-
Indicators that are closer to the center line can also provide useful information about market trends. For example, if the center line acts as support and the StochRSI lines are consistently above the 0.5 mark, this could indicate a continuation of a bullish or uptrend, especially if the lines begin to move toward the 0.8 mark.
Tips for use
As with conventional RSI, StochRSI is best used in conjunction with other indicators. Even if it is used with a traditional RSI it will give more accurate information about the asset.
Advantages and limitations
Key advantages
-
The indicator is easy enough to learn, which can be understood by a beginner with no experience in trading on the financial markets;
-
Despite its simplicity, it provides a lot of information about the asset: overbought or oversold zone, trend reversal, divergence;
-
Universal for different time intervals, but still it is better to customize it for the markets of interest;
-
Can be combined with other indicators to get more accurate information about the market state.
Main disadvantages
-
At high volatility in the market can give false signals for entry and exit from the deal;
-
RSI does not take into account fundamental factors, but relies only on market data;
-
Can not be used solo, requires confirmation from other indicators;
-
Not suitable for predicting long-term trends. Suppose some asset has increased in price by 100% and continues to grow, but the indicator will show the overbought zone, as its range is limited to the level of 100;
-
Dependence on the selected period, because of which you have to double-check the information on different timeframes.
Best Practices
-
Test strategies on historical data. This will help you understand what kind of information the indicator provides and how true it is;
-
Adapt RSI parameters for a specific asset. As mentioned above, the period to analyze can vary depending on the market selection;
-
Use a combination of indicators to increase accuracy. RSI cannot be used alone, so be sure to use other indicators to confirm the information obtained;
-
It is recommended that you customize your own RSI levels based on the selected market to determine the prevailing market trend. This will allow you to more accurately identify entry and exit points. For example, if the market is bullish, the RSI level should be set higher to avoid getting a false exit signal;
-
Observe your own risk management to save yourself from accidental losses. For example, you can withdraw no more than 2% of your deposit and use leverage no higher than 5x. This approach will allow you to control possible losses and limit them by multiples.
Common mistakes
-
Ignoring the trend. RSI can give false signals in strong trend conditions;
-
Over-reliance on a single indicator. Always use additional analysis tools;
-
Incorrect choice of period. Experiment with periods to find the optimal settings.
Conclusion
RSI (Relative Strength Index) is one of the most popular and universal tools of technical analysis, which is used by traders all over the world to assess market conditions and make trading decisions. We talked about the differences between technical and onchain analysis in this article. Its main task is to determine whether an asset is overbought or oversold, which allows traders to find optimal points for entering and exiting positions. However, like any tool, RSI has its strengths and weaknesses, and its effectiveness depends largely on the correct application, understanding of the market context and combination with other indicators.
Frequently Asked Questions
How accurate is RSI for cryptocurrency trading?
The accuracy of RSI depends on market conditions, but it is a useful tool for analyzing overbought/oversold and divergence, not an accurate indicator.
What is the best RSI period for cryptocurrencies?
Usually a period of 14 is used, but for cryptocurrencies you can experiment with shorter periods (like 7 or 9) because of the high volatility.
Can RSI predict price movements?
RSI cannot accurately predict price movements, but it can help identify potential reversal or trend continuation points.
How can I combine RSI with other indicators?
RSI is often combined with moving averages, Fibonacci levels or trading volumes to improve signal accuracy.
What are the most reliable RSI signals?
Divergence and breakouts through key levels (30, 70) are considered the most reliable signals, especially when confirmed by other indicators.
Want to learn more about crypto arbitrage?
Get a subscription and access the best tool on the market for arbitrage on Spot, Futures, CEX, and DEX exchanges.

