Crypto Technical Analysis: Where to Start?

Cryptocurrency Technical Analysis: A Comprehensive Guide
The study of investment activity and trading begins with market analysis methods that help predict price movements. Debates over which is better: fundamental or technical analysis – do not subside to this day. This division is perhaps the most significant misconception for many novice traders, as other types of analysis exist, each providing investors with completely different information.
All analytical tools should be used in conjunction, as one method complements another and allows for the most complete picture of what is happening. In this article, we will talk about technical analysis: how to analyze the market using indicators, candlesticks, trading volumes, and patterns.
What is Technical Analysis?
Technical analysis is a method of forecasting price movement based on historical data. For example, if an asset's price has repeatedly failed to pass the $100 mark, there is a high probability that the rate will soon fall, as there are no buyers above the $100 level. If there is no demand, the balance of power in the market tips toward sellers, and the asset price will decrease.
Technical analysis is often called trading psychology because, during the rise or fall of an asset's value, most investors rely on the same indicators and price levels.
Why Analyze Cryptocurrency?
Cryptocurrency is an investment asset just like others traded on financial exchanges. Technical analysis has been used in trading for decades precisely because it has proven itself as an effective analytical tool.
The cryptocurrency market is characterized by high volatility, which makes it particularly attractive to traders and simultaneously risky. To avoid acting at random and to make informed decisions, it is important to conduct analysis – and the technical approach is especially useful in this case.
Analyzing cryptocurrency charts helps to:
- Determine potential entry and exit points in the market;
- Assess the strength of a trend and the probability of its reversal;
- Build a trading strategy based on repeating market templates;
- Understand the behavior of other market participants – since technical analysis reflects mass psychology.
Even though the cryptocurrency market can be influenced by news, social trends, and the opinions of public figures, it is charts and indicators that allow for an objective view of what is happening. Thus, analyzing cryptocurrency using technical tools is necessary to minimize risks and increase trading efficiency.
Main Methods of Technical Analysis
Today, there are many methods of conducting technical analysis, each unique in its own way. Below are the main and easiest-to-understand types of technical analysis for beginner traders.
Classical (Graphic) Analysis
Graphic analysis can be called the most popular among traders, as it is used in 90% of cases. It is not just about its simplicity for beginners, but because graphic analysis provides the most accurate results, helps identify trends, and finds entry points for trading positions and profit-taking points.
The first and simplest example of using graphic analysis is determining a market trend or trend channel. To do this, draw two parallel lines through price highs and price lows. It is preferable to draw lines through the body of the candle (the wide part) rather than the wick (shadow). By forming a trend channel, you can notice that the price moves from the support line (bottom) to the resistance line (top). If a price reversal occurs from any level, you can look for an entry point and trade from support to resistance until a breakout from the channel occurs (white ellipse).

In addition to the traditional trend, there are also specific graphic patterns or figures that can signify either a continuation of price movement or its reversal. For example, the most popular trend continuation figure is the flag or pennant. After an impulsive fall or rise in price, a small consolidation usually occurs (at which point the flag or pennant is formed). After some time, the price continues moving in the same direction.
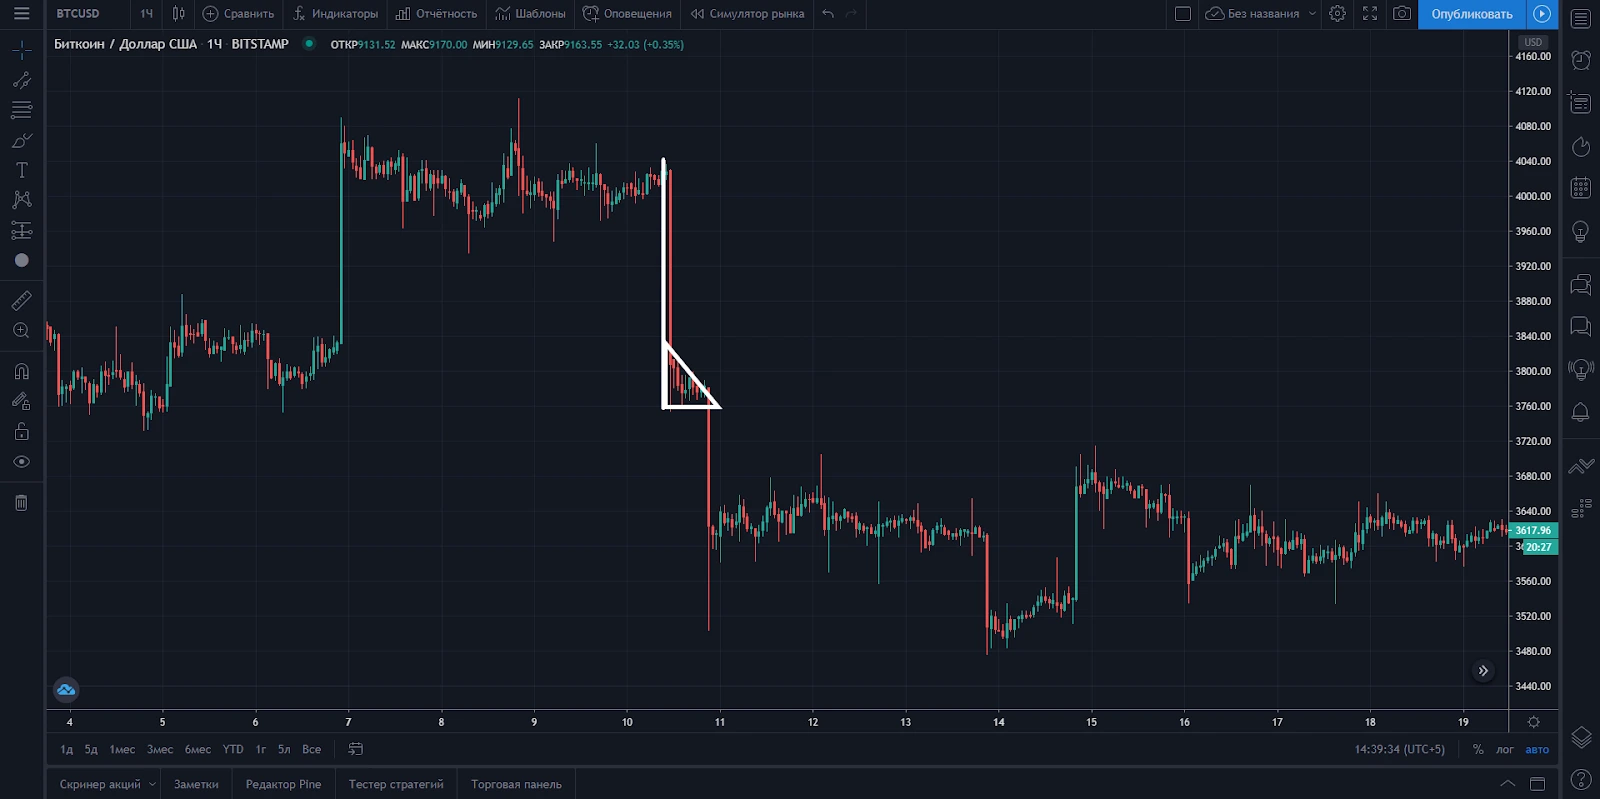
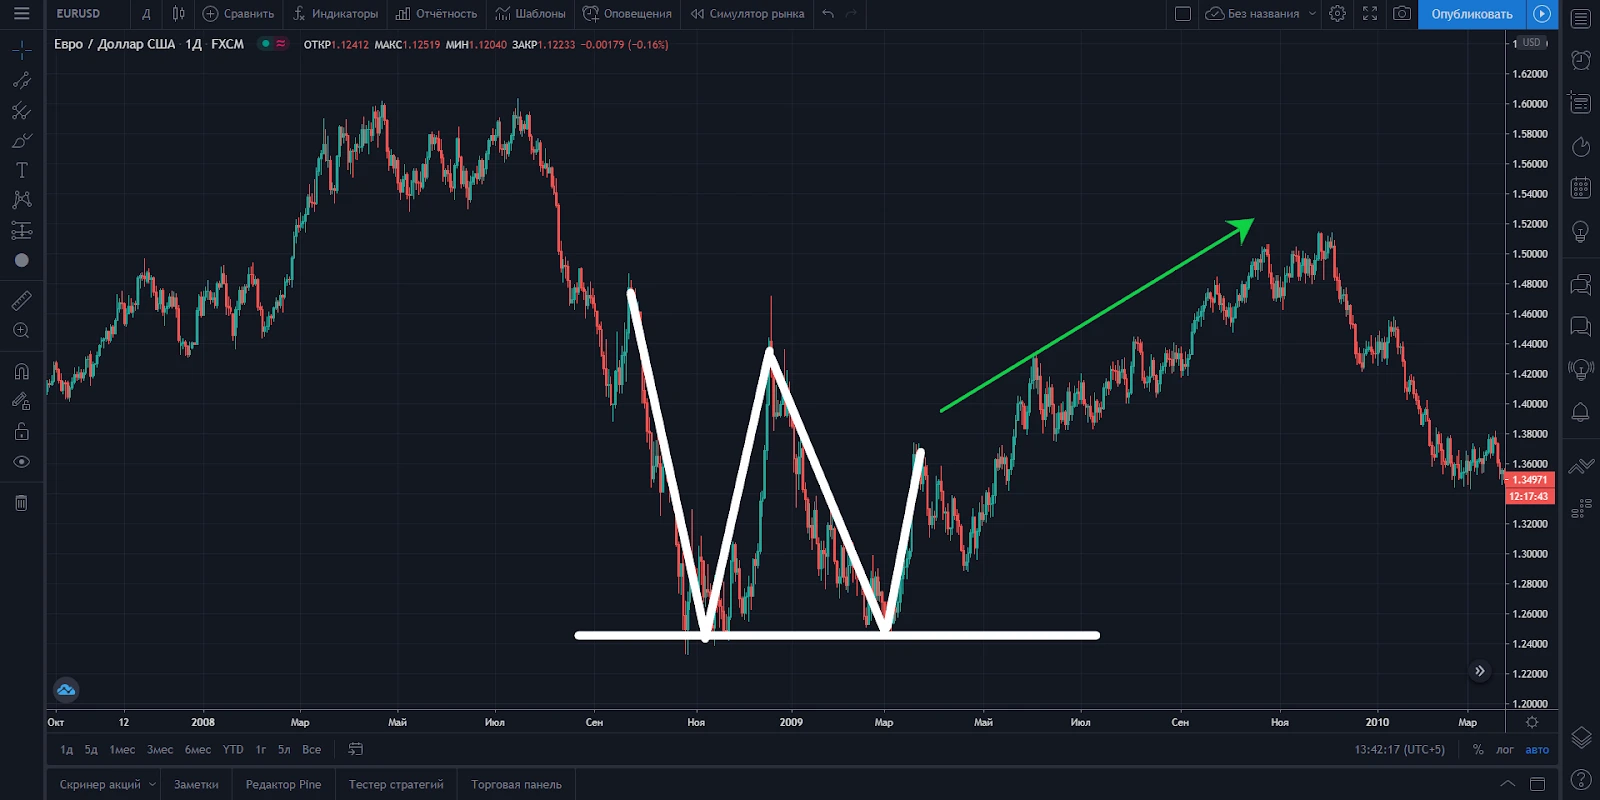
The simplest and most accurate figure in graphic analysis can be considered the reversal patterns "Double Bottom" or "Double Top." As a result of two strong attempts to break a price level, a W or M shape forms on the chart, which may indicate the end of the current trend and a price reversal.
This is by no means an exhaustive list of various figures and methods for conducting graphic analysis. It's worth noting that the probability of any pattern working out, whether it's a "Double Bottom," "Triangle," or "Head and Shoulders," is always 50/50 and depends on many factors, not just the appearance of the figure on the chart.
Analysis Using Mathematical Algorithms (Indicator Analysis)
One of the principles of Charles Dow, the founding father of technical analysis, states that history in markets always repeats itself. Simply put, financial markets are cyclical, and the price always strives for an average value or balance between supply and demand. Growth is followed by a fall, and a crash by a rise. Based on this principle, technical analysis indicators were developed in the computer age to help traders perform complex mathematical calculations automatically.
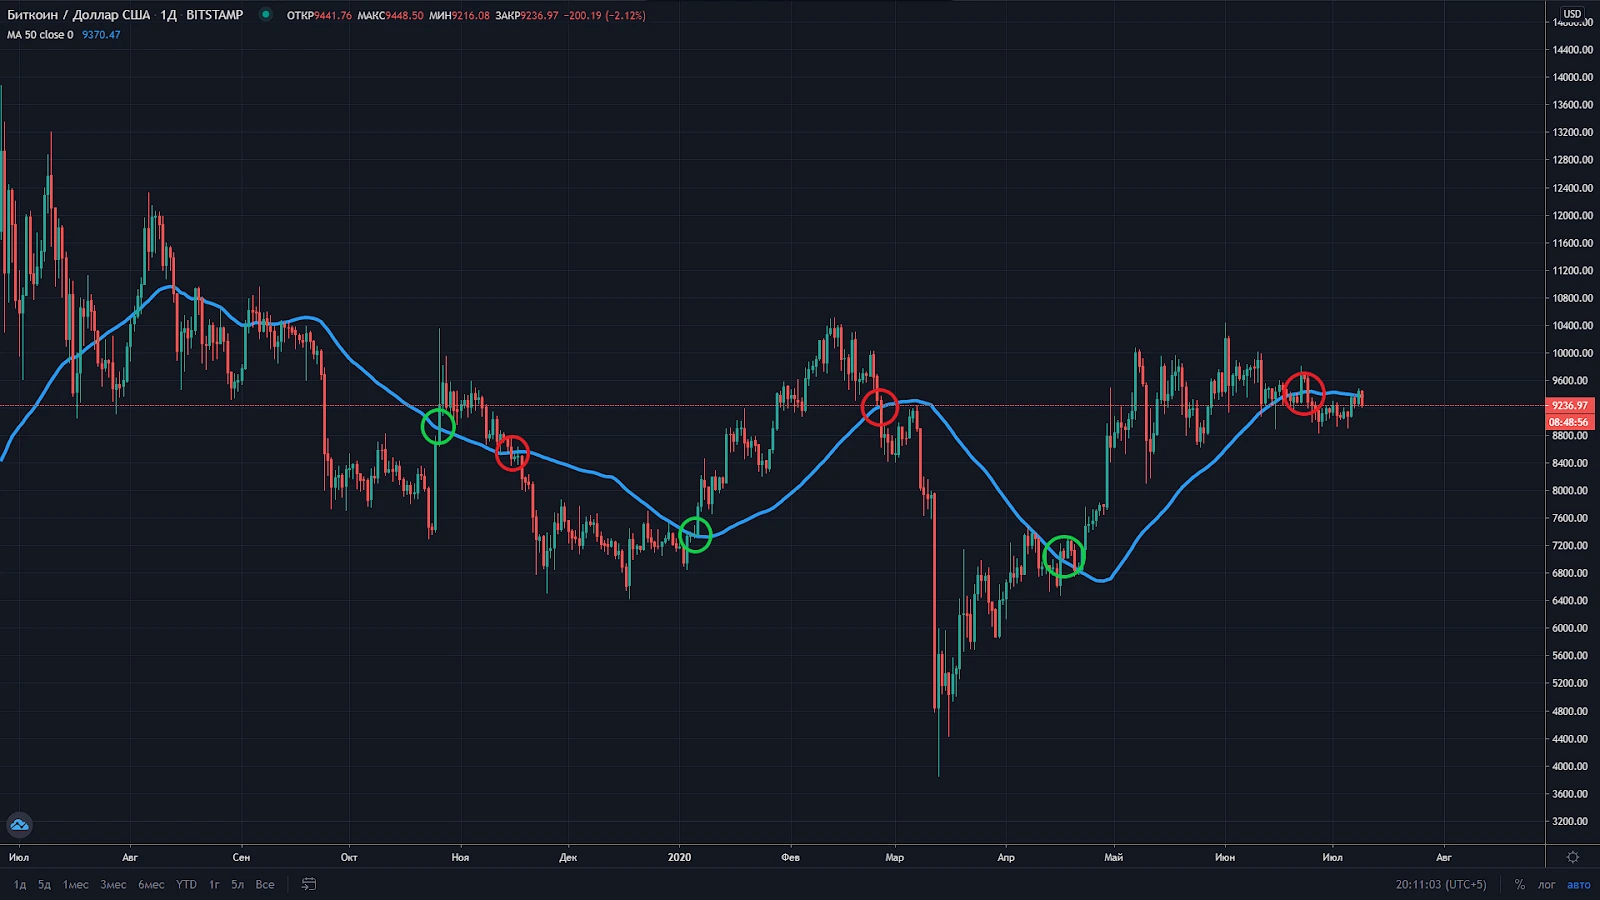
The most popular and easiest to understand is the Moving Average (MA) indicator. Its task is to show the average price value over a certain period or for a set number of candles. For example, the screenshot below shows the average price over 50 days. When the price crosses the MA line from top to bottom, you can look for entry points for sell trades, and when crossing from bottom to top – for buy trades.
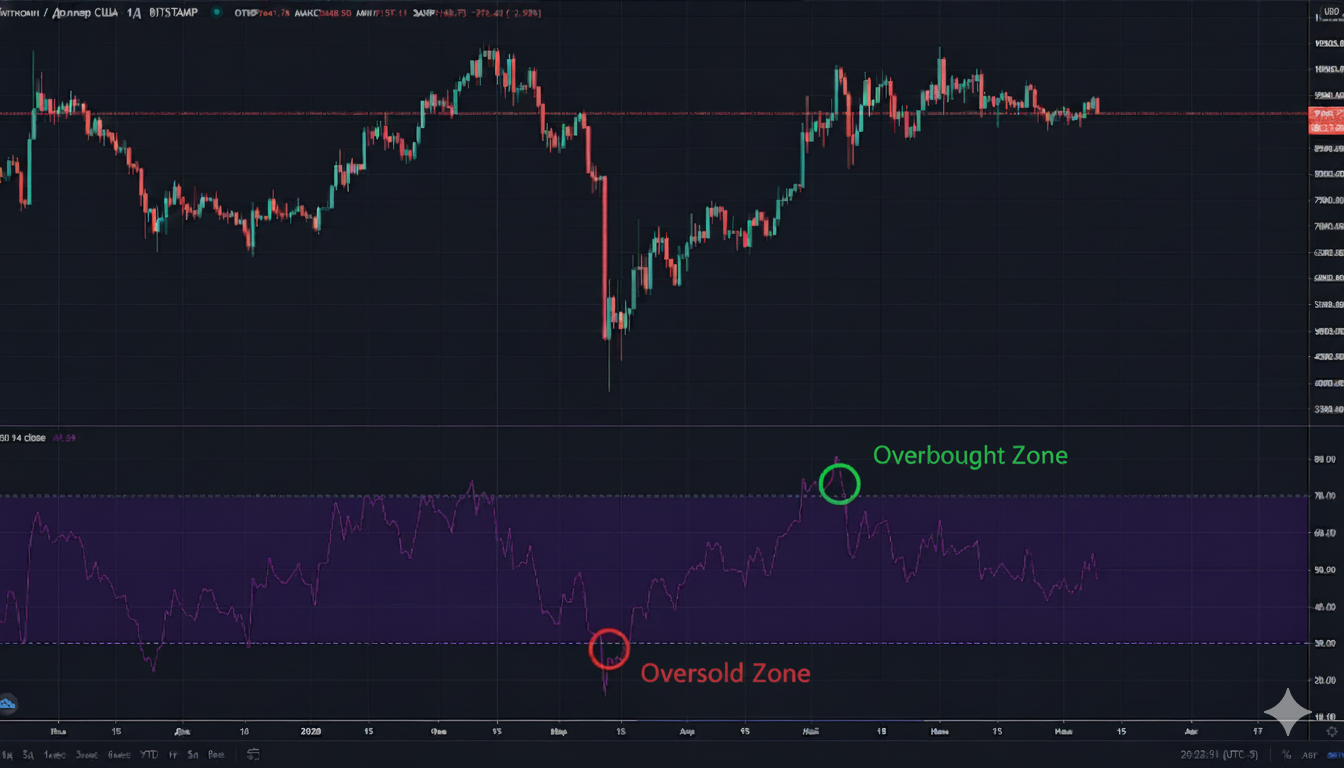
Another popular indicator easy for beginners is the RSI (Relative Strength Index). It shows overbought and oversold zones of an asset over 14 periods. You can independently change this value to find the most suitable period for yourself. A drop in the index below 30 indicates an oversold asset, meaning seller pressure was so strong that the price fell below a fair level, allowing for buy entry points. A rise above 70 is an overbought zone where the asset is overvalued, allowing for sell entry points.
Volume Analysis
Impulsive price growth or decline always occurs against a backdrop of large trading volumes. This is logical: if someone bought or sold $1,000 in a market with multi-billion-dollar turnovers, no one would notice. It's a different story if someone bought or sold a billion. Analyzing trading volumes is quite problematic because, as a rule, a large amount is injected into the market in an instant, and the trade must be opened immediately.
However, opening such a position is very risky, as one large player can be opposed by another. The price in this case can fluctuate significantly. Without special software like Volfix, trading on volumes is practically impossible. Using special software, you can conduct, for example, delta-cluster analysis, which tells you where liquidity is concentrated and from which price level an impulsive movement might occur. An increase in volume can accompany both a price drop and a rise, but determining price direction solely by volume is impossible.
Candlestick Analysis
Searching for the most accurate levels to open a trading position can be done with candlestick analysis. Candle movement depends on the psychology of trader behavior, just like trends or price levels, so the appearance of certain candlestick patterns can signal a price reversal or continuation of current dynamics.
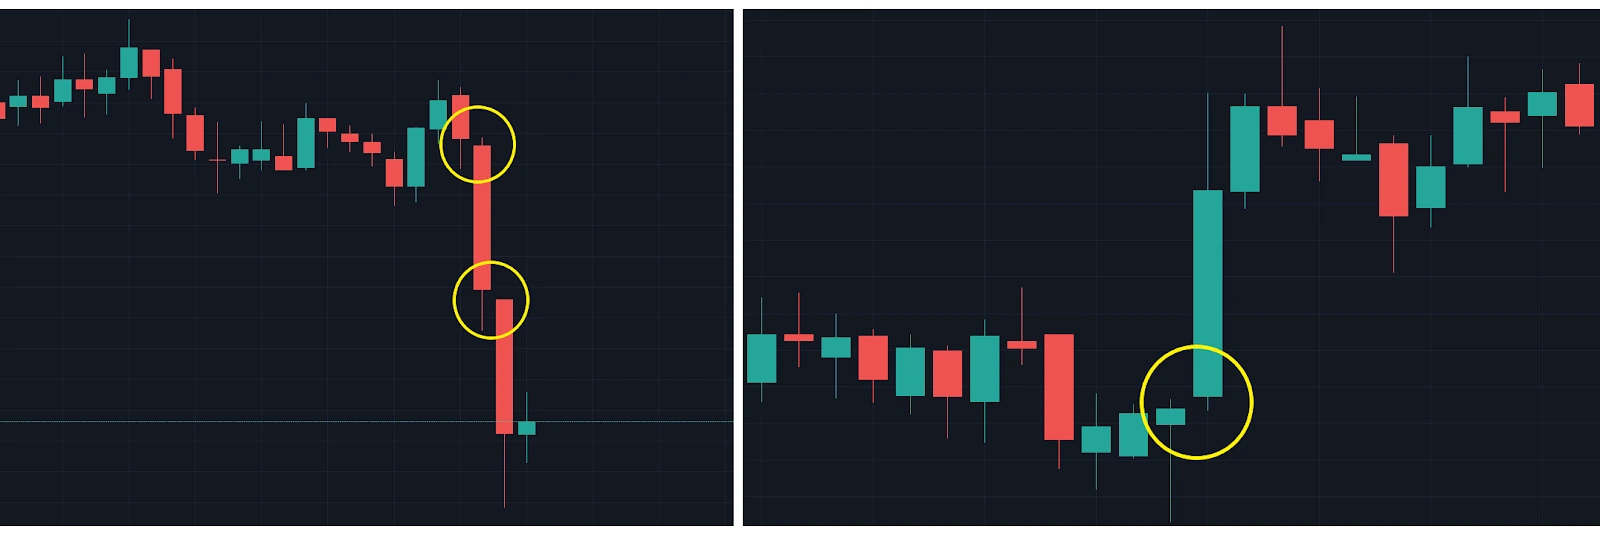
The reversal pattern "Pin Bar" comes from the full name Pinocchio Bar. This pattern formally resembles the fairy-tale character Pinocchio, and its appearance on the chart signals a price reversal.

Full candles on the left and right are the eyes, and the candle with the long shadow between them is the nose. This pattern forms because the price tried to reach or break a certain level, but sellers or buyers quickly pushed it back. In this case, we see how buyers didn't let the price go lower, and a reversal with subsequent growth occurred.
Another pattern suitable for beginners is the trend continuation "Gap." Its accuracy and high success rate are due to it appearing rarely and only during periods of high volatility. When impulsive growth or decline occurs, the demand of sellers and buyers starts to differ significantly. For example, a seller wants to sell Bitcoin for $10,000, but the nearest buy offer is at $9,995, resulting in a price gap at the moment one candle closes and the next opens. Such moments indicate a serious superiority of sellers over buyers, and vice versa.
Main Myths and Misconceptions About Technical Analysis
The main myth about any type of analysis—technical, fundamental, delta-cluster, or intermarket—is that one is better than another. This is far from true. The ideal option is to use them in combination, where one method complements another.
According to another common myth, technical analysis of financial markets is irrelevant and doesn't work as it did in the past. Throughout its century-long history, this method has only been refined and has always worked excellently; however, do not forget that the market is unpredictable, as it has always been. Often theory does not coincide with market reality – and this is quite natural; otherwise, after studying candlestick patterns or Fibonacci levels, everyone in the world could trade only in profit.
Traders often claim that technical analysis works on one market but not another. This myth exists because one type of price forecasting is insufficient for a full picture. Each method works differently for each asset type, and the technical analysis of the Forex market will differ from the stock market or the crypto market.
To minimize losses, be sure to use risk management tools in your strategy. Technical analysis allows you to determine market direction and indicate possible entry and exit points, but not with 100% probability. To avoid losing capital, use stop-loss orders or risk hedging strategies.
Disadvantages of Technical Analysis
Despite its popularity, technical analysis is not a universal panacea and has several limitations:
- Lack of consideration for fundamental factors. News, regulatory changes, or actions by large players can cardinally change price movement, which technical analysis does not account for;
- Probabilistic nature. No indicator or candlestick pattern can guarantee a 100% outcome – there is always a chance for a false signal;
- Subjectivity. Different traders can interpret the same charts or figures differently, which can lead to opposite decisions;
- Indicator oversaturation. Using a large number of tools can only confuse the trader, creating "noise" instead of a clear picture;
- Signal lagging. Many indicators, especially moving averages, provide signals with a delay, after the market movement has already begun;
Understanding these limitations is important to use technical analysis wisely, without relying on it as the sole source of information.
Frequently Asked Questions
Is it possible to trade using only technical analysis?
Yes, many traders use only technical analysis. However, its effectiveness increases when combined with fundamental and on-chain analysis.
Does technical analysis work the same on the crypto market as on the stock market?
The principles remain similar, but the cryptocurrency market is more volatile and less mature. This means some patterns might play out differently, requiring extra caution.
Which indicator is the most accurate?
There is no universal indicator that works always and everywhere. The best approach is a combination of several complementary indicators (e.g., RSI + Moving Averages + Volumes).
Why does the same pattern work differently?
The market changes under the influence of many factors. The same pattern may work successfully in one case and fail in another due to differences in volume, news background, participant sentiment, and overall market dynamics.
How long does it take to learn technical analysis?
A basic understanding can be gained in a few weeks, but confident use will require practice over several months. Deep mastery comes with experience and regular self-analysis of trades.
Conclusion
Technical analysis is an indispensable part of any trader's knowledge arsenal. Regardless of your trading strategy or skill level, you will use technical analysis either as a way to determine entry and exit points or as a way to understand the current sentiment and psychology of other financial market participants. Arbitrage Scanner enhances your analysis by automatically finding price imbalances between exchanges and helping you profit even from minimal market fluctuations. Simply put, technical analysis is essential in trading – and with Arbitrage Scanner, your trades become even more accurate and profitable!
Want to learn more about crypto arbitrage?
Get a subscription and access the best tool on the market for arbitrage on Spot, Futures, CEX, and DEX exchanges.

You might be interested

Crypto Fear and Greed Index: How to Understand and Use It

The best indicators for cryptocurrency trading in 2024
Beginner's Guide to Basic Technical Patterns
