TradingView: overview of the official website and platform features

TradingView beginner’s guide
Before making any investment, whether in stocks, cryptocurrencies, or commodities, you must learn how to “read” a price chart. For some people, checking a price chart literally means a quick glance to spot any obvious anomalies, while for others it means doing full technical analysis using support and resistance levels to find the optimal entry point.
The second type of investor needs a proper analysis tool and, as the title suggests, TradingView is considered one of the best. In this guide, we take a closer look at the platform: what TradingView is, which tools are available, what plans it offers, and much more.
What is TradingView?
TradingView is charting and stock analysis software available in both free and paid versions. Traders can view price charts across multiple financial markets and a wide range of asset classes, including stocks, currency pairs, commodities, cryptocurrencies, futures, and bonds.
The platform claims to offer a powerful publishing toolkit as well as social-trading features. Social integration lets traders and investors share thousands of trading ideas and technical analyses with other traders around the world. In addition, TradingView is cloud-based, so traders can access the site from any mobile or desktop device.
This way, traders can monitor candlestick charts and even perform technical analysis right from their mobile devices. Although trading only from a phone is not recommended, the app makes it easy to track trades, especially when you are away from your desk.
Advantages
-
30-day free trial for all three paid subscription tiers.
-
Annual plans can be paid in BTC if you choose a yearly subscription.
-
Users get real-time stock‑market news as it comes in, helping them stay on top of market moves.
-
Includes an easy-to-use text tool for notes on the chart so you can write down your thoughts and trading ideas.
-
Provides company earnings, stock splits, and dividend data to help you make better‑informed decisions.
-
Includes an economic calendar of key events that may cause market volatility.
-
Traders get access to a real‑time list of the 20 worst‑ and best‑performing stocks on the market.
-
Lets users route trades to selected brokers directly from TradingView charts.
-
Offers many customizable options for charts, indicators, and layouts.
Disadvantages
-
While there is a free plan, paid tiers are far ahead in terms of features and data access.
-
It is not always clear whether drawings you created on your charts have been saved properly.
-
The TradingView news feed is somewhat weak and many users complain that it lacks depth and context.
-
You need a Premium subscription to unlock some basic‑looking but advanced features like fast customer support and multi‑chart layouts.
Getting started with TradingView
Choosing a plan
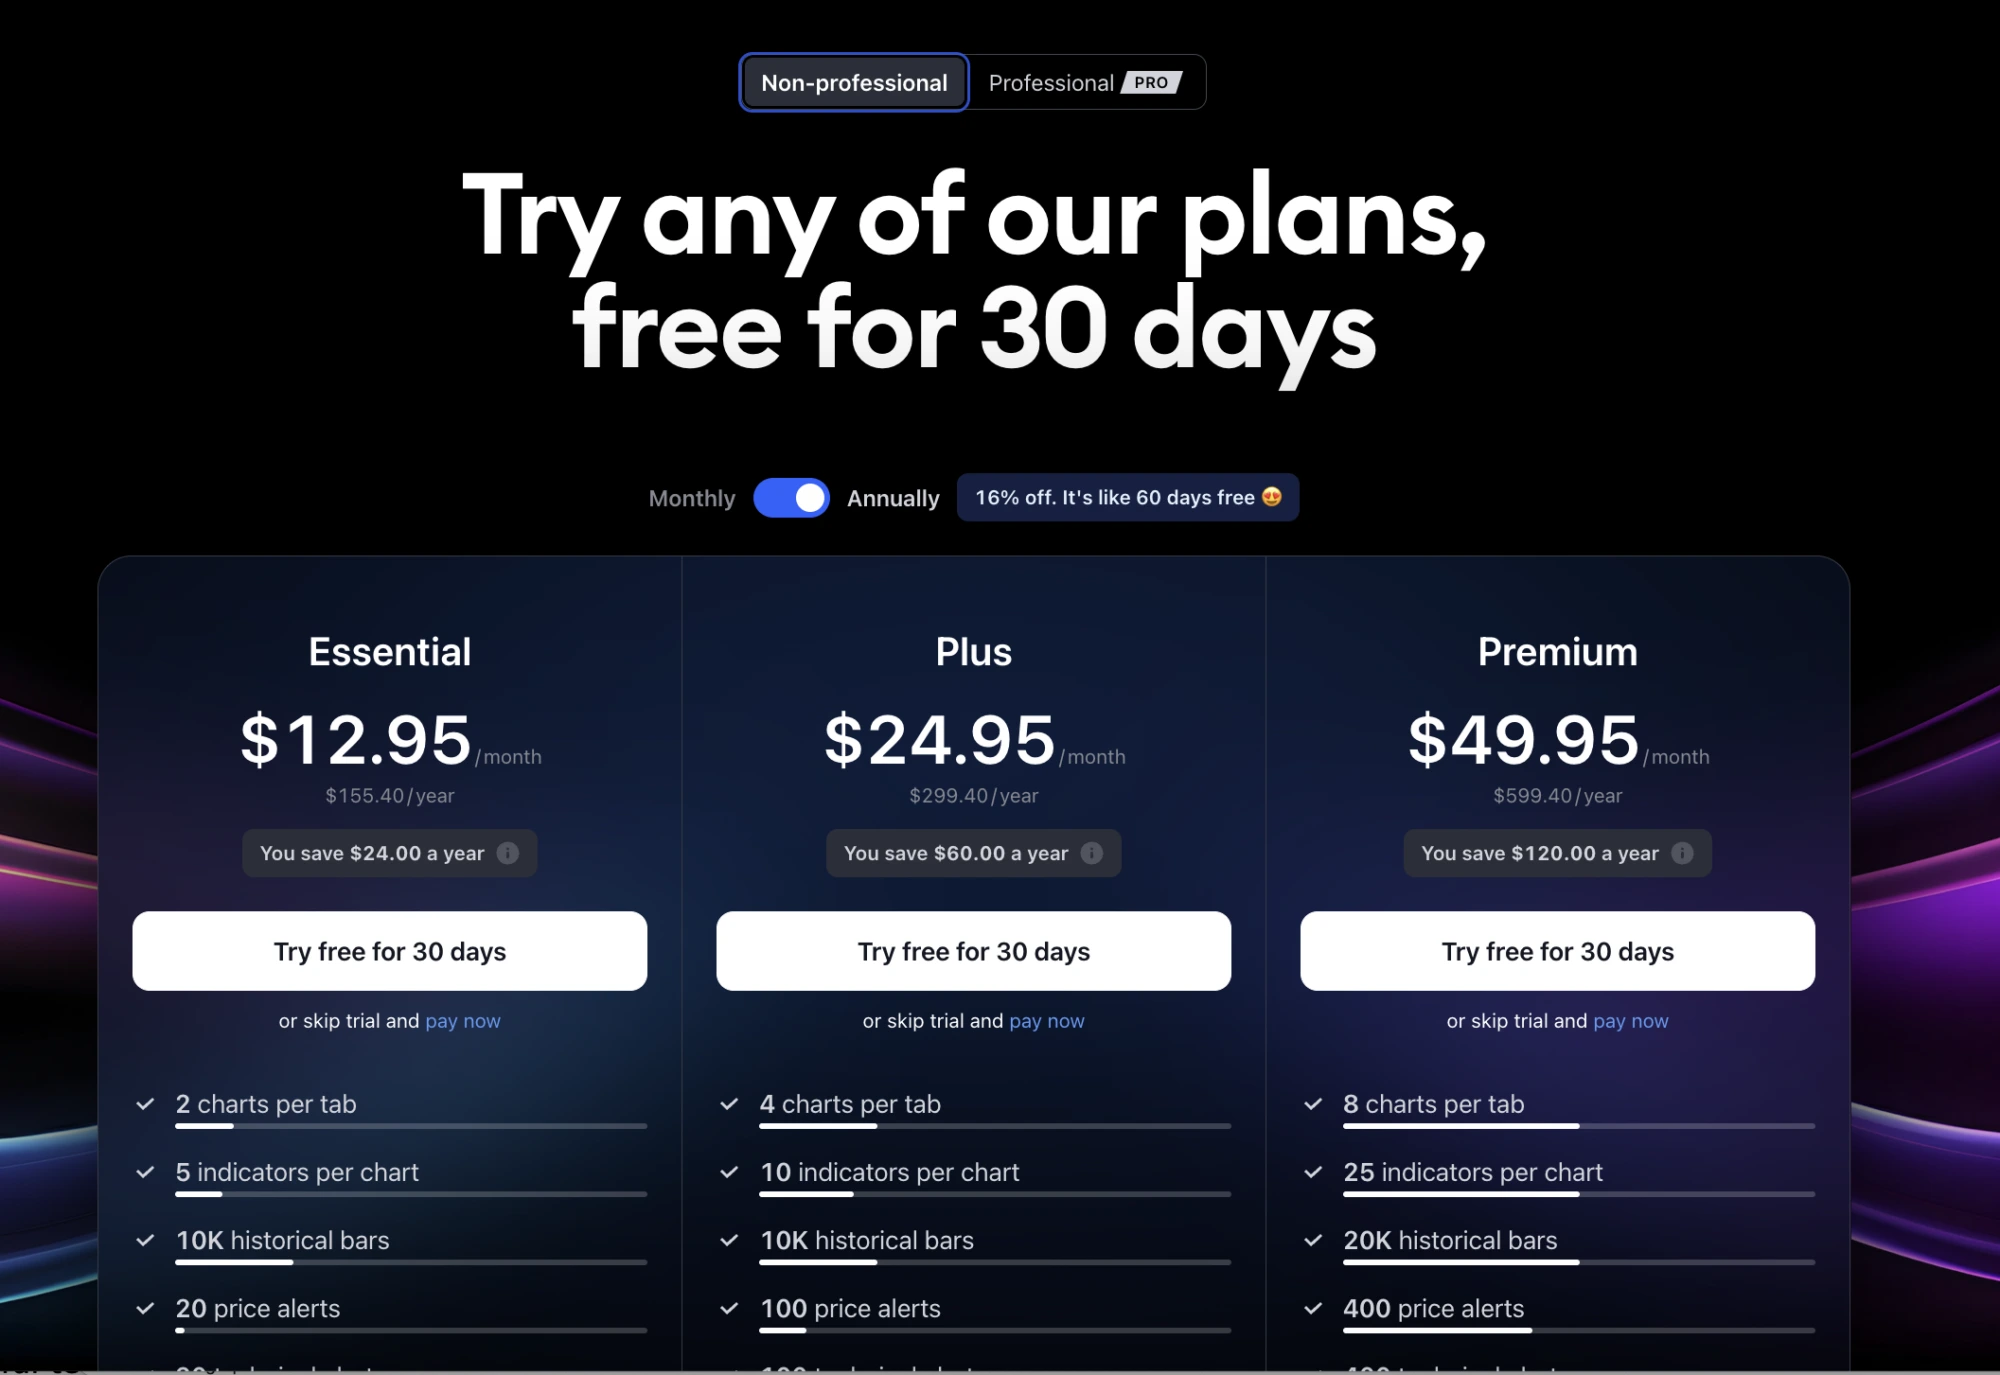
There are four subscription plans to choose from:
-
Free. The free plan offers a limited feature set and lets users link their TradingView account with Facebook or Google. It includes one server‑side alert, one chart per layout, three indicators per chart, advanced watchlists, a stock screener, built‑in technical analysis, and the ability to publish private ideas.
-
Pro. Compared to the free plan, Pro offers two charts per layout, at least 10 server‑side alerts, 5 saved chart layouts, more indicators per chart, unlimited watchlists and indicator templates, plus more options for real‑time data. The price is $12.95 per month.
-
Pro+. This plan unlocks a wide range of advanced features, including 4 charts in a single layout, 30 server‑side alerts, up to 10 indicators per chart, 10 saved chart layouts, faster customer support, and the ability to be logged into two devices at the same time. The price is $24.95 per month.
-
Premium. The Premium plan includes up to 8 charts per layout, 25 indicators per chart, more than 100 server‑side alerts, priority customer support, SMS server‑side alerts, extended trading hours, and intraday spread charts. The price is $49.95 per month.
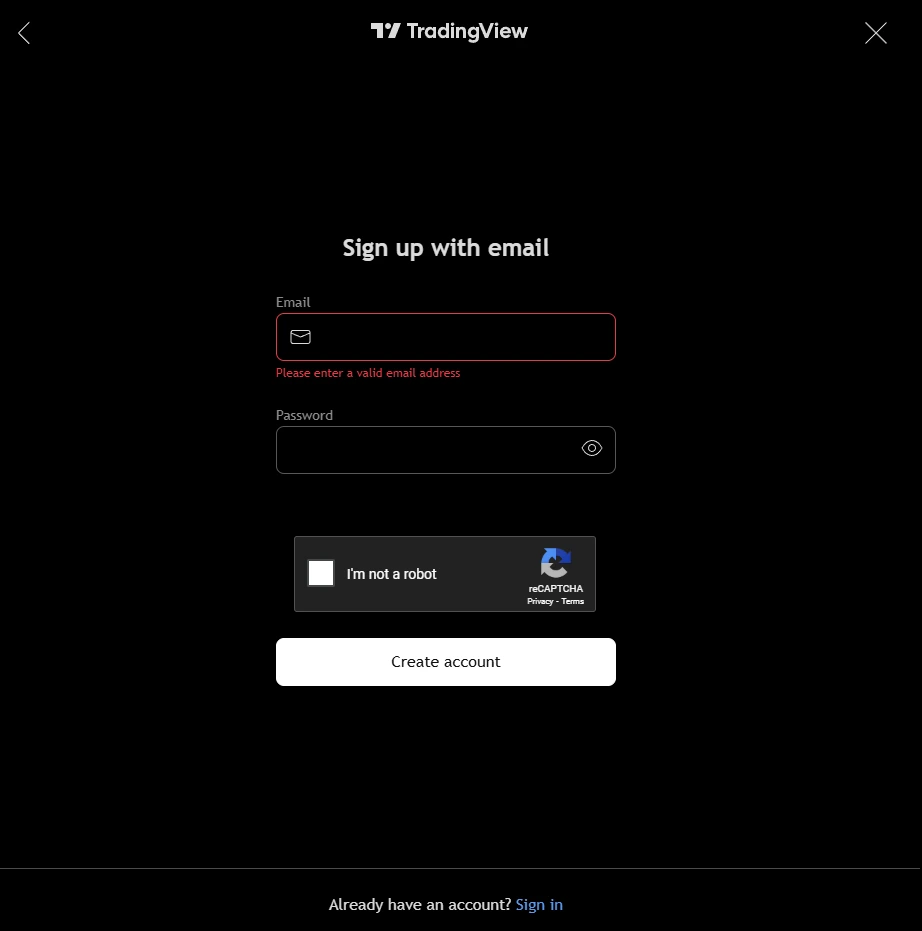
Sign‑up process
To create an account on TradingView, go to the official website and click the “Sign Up” button. You can sign up using your Facebook, X, Apple, Google, LinkedIn, or Yahoo accounts. If you do not have any of these, you will need the following:
-
An email address.
-
A password you create yourself.
-
A quick CAPTCHA check to confirm that you are not a robot.
Overview of TradingView tools
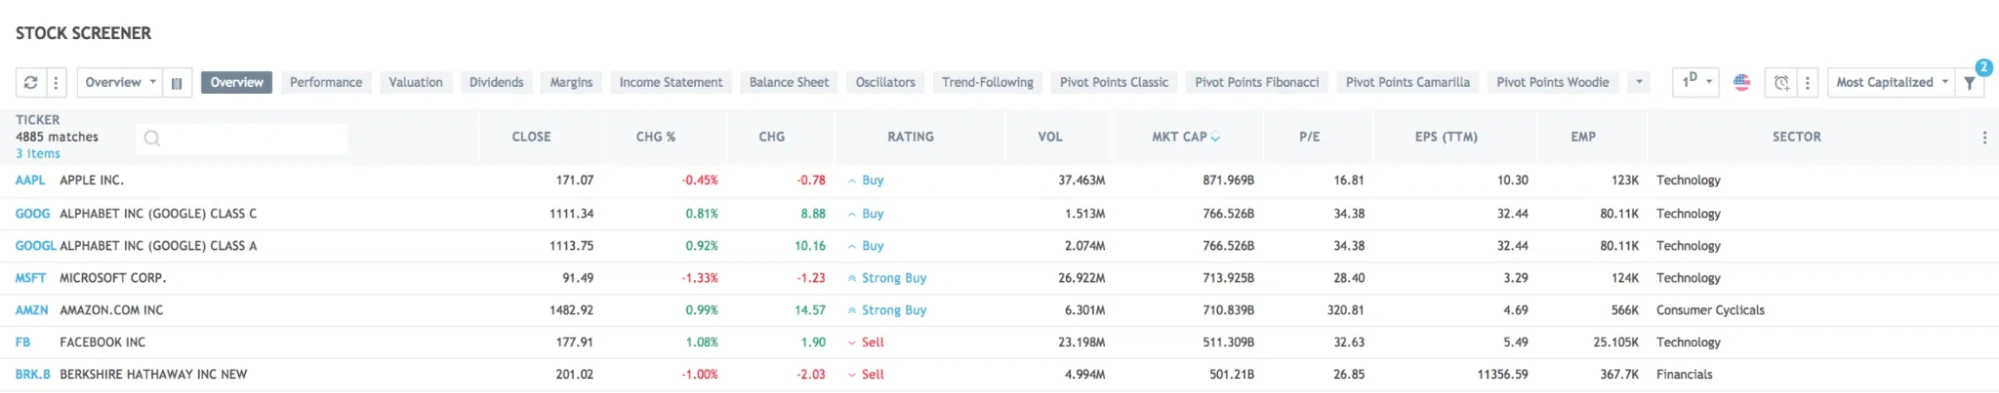
Stock screener
The stock screener is an extremely useful tool for both active traders and long‑term investors because it lets you filter stocks using specific criteria.
The TradingView screener includes more than 100 searchable fields and offers real‑time alerts on both international and US markets. Their stock screener allows users to search any available instrument and its chart, then apply filters on top.
Filters are designed to help you find stocks you actually want to trade or to build your own custom filter if that suits your strategy better. Traders can scan and sort stocks by fundamental metrics, technical indicators, or a combination of both.
Alerts
Alerts are another powerful feature of TradingView. Traders can set alerts for almost any condition imaginable: for example, price levels, indicator values, custom conditions, or even drawing tools. This feature is highly flexible and gives traders at least 10 different alert conditions in each of the available categories.
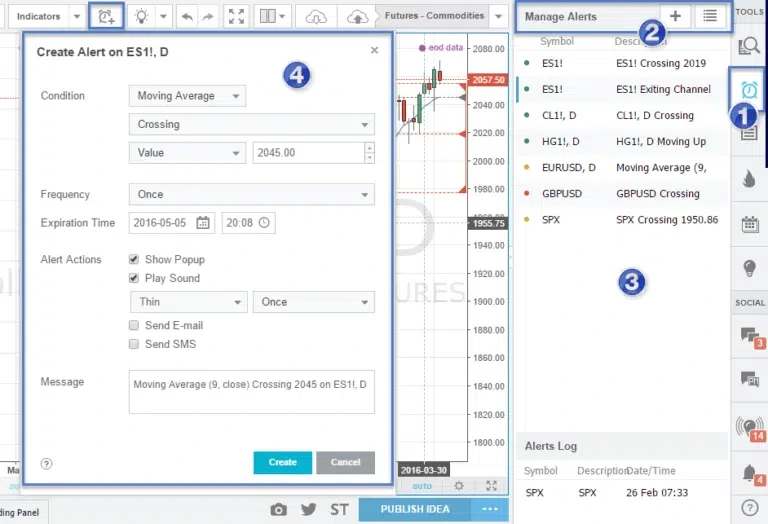
You will receive alerts as sound notifications, SMS, pop‑up messages on your screen, or emails whenever a symbol meets your criteria.
Pine Script
TradingView makes the platform highly personalized through multiple customization options. With the Pine Script tool, users can create their own indicators from scratch for more granular analysis of financial markets.
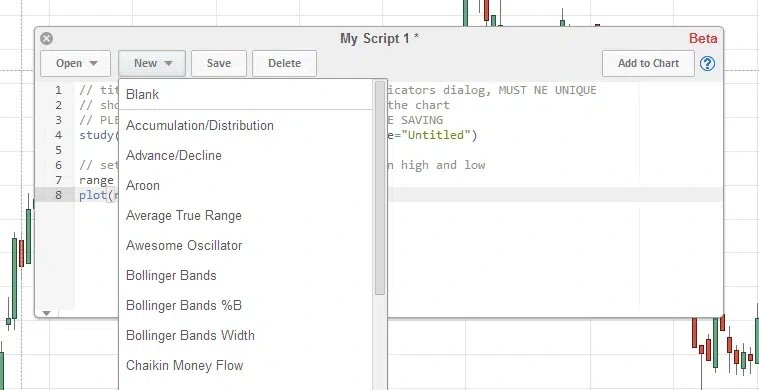
This tool also lets you edit and customize code for built‑in charts, existing technical indicators, and basically any trading concept you want to test.
Traders can also backtest their own strategies and leverage some of the prebuilt scripts for live trading. If you do not want to write code yourself, you can choose from more than 100 ready‑made scripts that support deep technical analysis.
HTML5 charts
The platform offers a wide range of charting features that are easy to navigate. Traders can quickly analyze the technical picture of any given chart.
From chart‑to‑chart comparison to a wide choice of indicators and price chart types, this feature can become a valuable tool for any trader, whether beginner or experienced. Charts can also be resized in real time, and users can add indicators, change timeframes, and do everything needed for analysis.
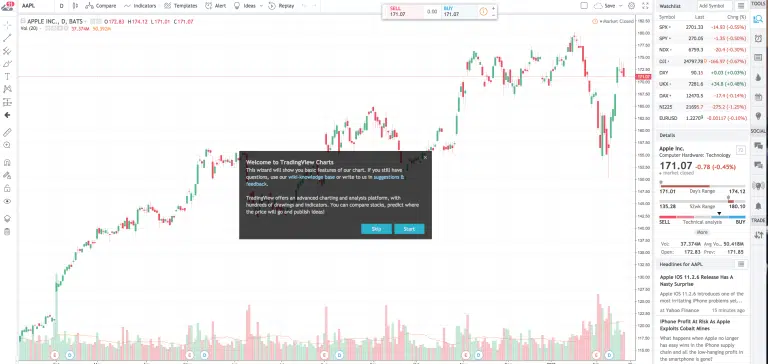
TradingView also includes more than 50 smart, easy‑to‑use drawing and charting tools in all subscription tiers. These tools help traders closely track how chart patterns form and how price behaves.
Paper trading simulator
Another notable feature of TradingView is its paper trading mode, which is how the platform describes its built‑in trading simulator. This feature is especially useful for beginners who do not yet feel confident trading with real money. With paper trading, users can trade virtual funds in a simulated environment and practice their strategies without risking their capital.
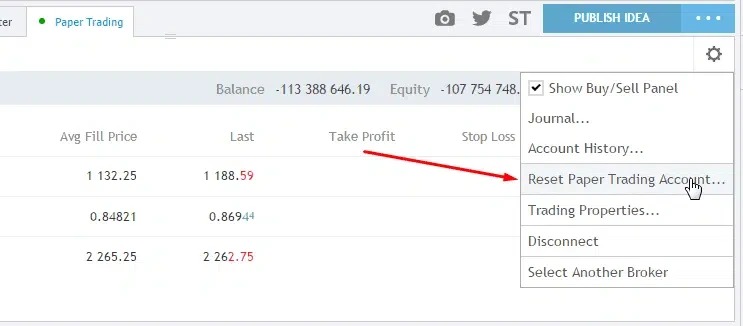
In demo mode, traders can work with any assets available on TradingView, including cryptocurrencies, futures, and stocks. The only real drawback of the simulator is that it does not provide detailed information on order book and market microstructure, which is very important for intraday trading.
Automated indicator rating
This tool saves you time by instantly showing whether indicators are bullish, bearish, or neutral. The rating aggregates moving averages and oscillators based on price and volume, so TradingView’s buy and sell signals work well as a quick sentiment gauge via the Fear & Greed‑style dashboard.
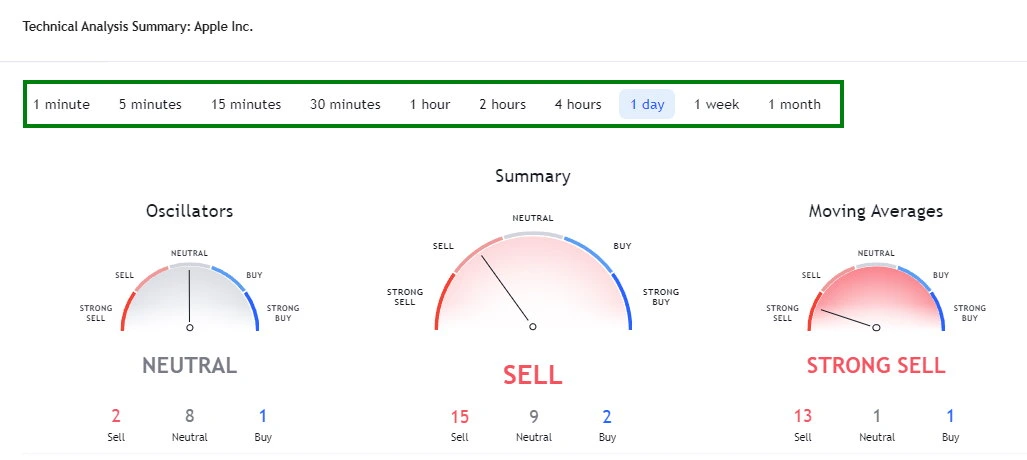
When you open a chart and click “Technical indicators,” you will see three gauges. The left gauge shows oscillators such as the Relative Strength Index (RSI), Stochastics, and the Average Directional Index, while the right gauge displays different moving averages including simple, exponential, and the Ichimoku cloud.
Each component is averaged into a single overall rating of “Buy,” “Sell,” or “Neutral,” which provides a convenient way to automate parts of your technical analysis.
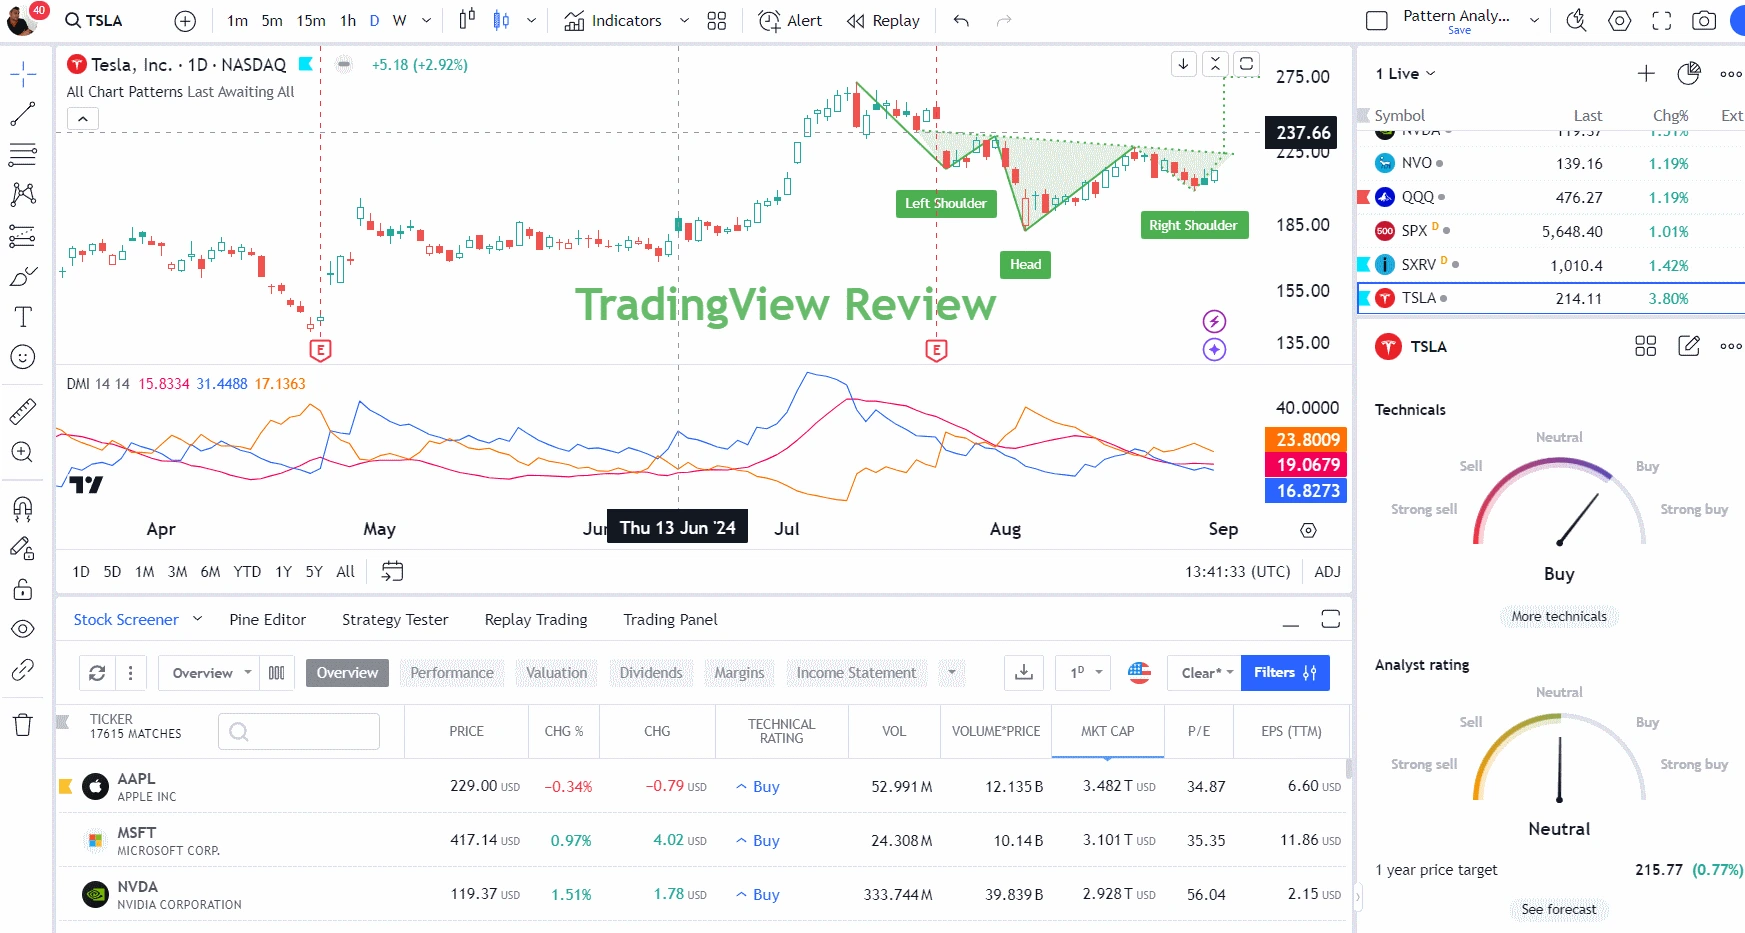
Finding investments
The TradingView stock‑analysis screener includes 160 different criteria. You can work with common metrics like EPS, quick ratio, and P/E ratio, or more unique data points such as employee count and enterprise value.
You can customize columns and filters to match your process. For example, in the screenshot the table is configured to display employee count, P/E ratio, and EPS TTM.
Strategy tester
The TradingView strategy tester is incredibly easy to use and flexible enough to test advanced strategies. Despite some drawbacks, such as the need to learn Pine Script to code strategies and the inability to test on entire stock baskets, it still offers several impressive features.
One of the standout strengths is its active community. Many users develop and sell stock‑analysis systems, and if you have a Premium subscription you can even create and sell your own. The community shares a wide range of indicators and systems, many of which are free to use.
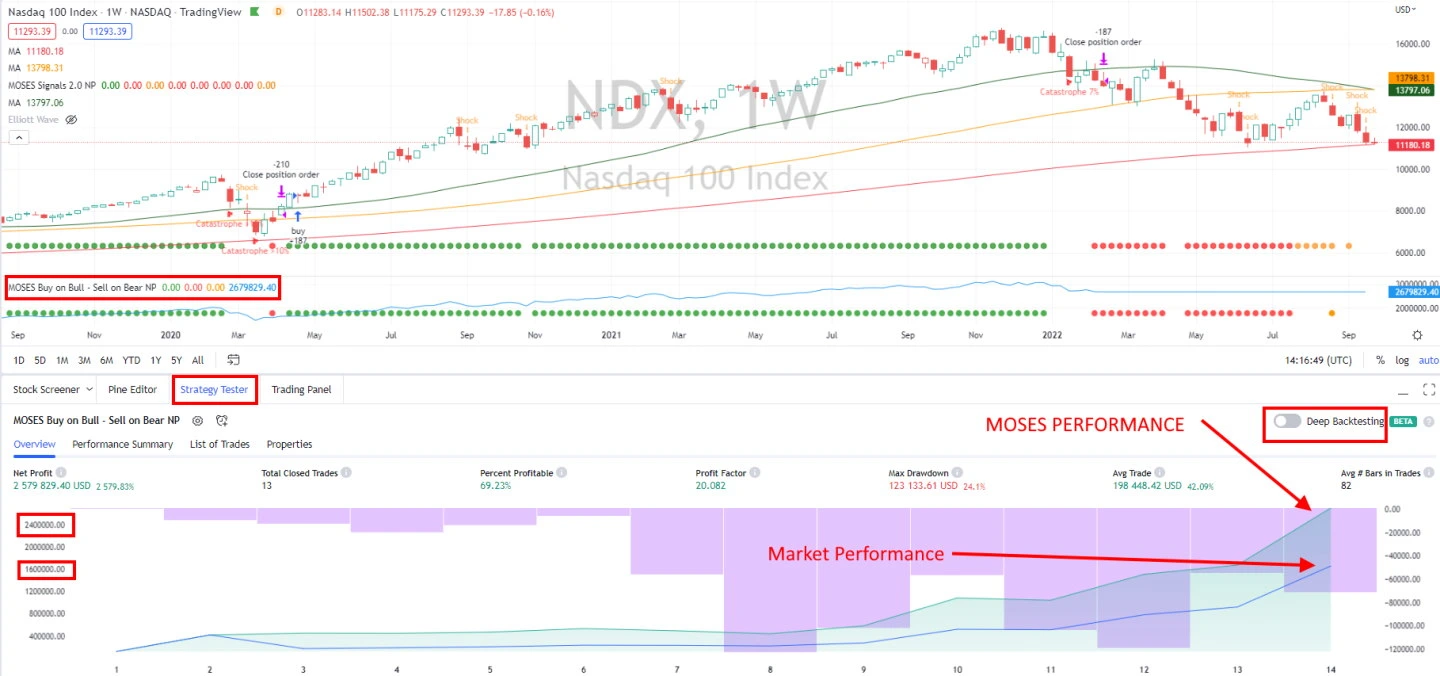
When it comes to backtesting, TradingView makes the process much simpler. For example, you can use a built‑in strategy called “Slow Stochastics,” which opens a trade when indicators show that a stock is oversold and closes it when it becomes overbought. To see the results, you only need a few clicks: open the strategy tester and add the chosen strategy.
Here are some of the key performance metrics TradingView reports after strategy testing:
-
Net profit.
-
Drawdown.
-
Return vs. buy‑and‑hold benchmark.
-
Win rate (percentage of profitable trades).
-
Total number of trades.
Another useful feature is market‑activity replay. It lets you go back in time, replay historical price action, and see how trades would have played out on the chart. All buy and sell orders are clearly marked and highlighted directly on the chart.
Chart pattern recognition
TradingView offers automatic recognition of 48 candlestick patterns at no extra cost. This feature works globally across stocks, exchange‑traded funds, currencies, and cryptocurrencies.
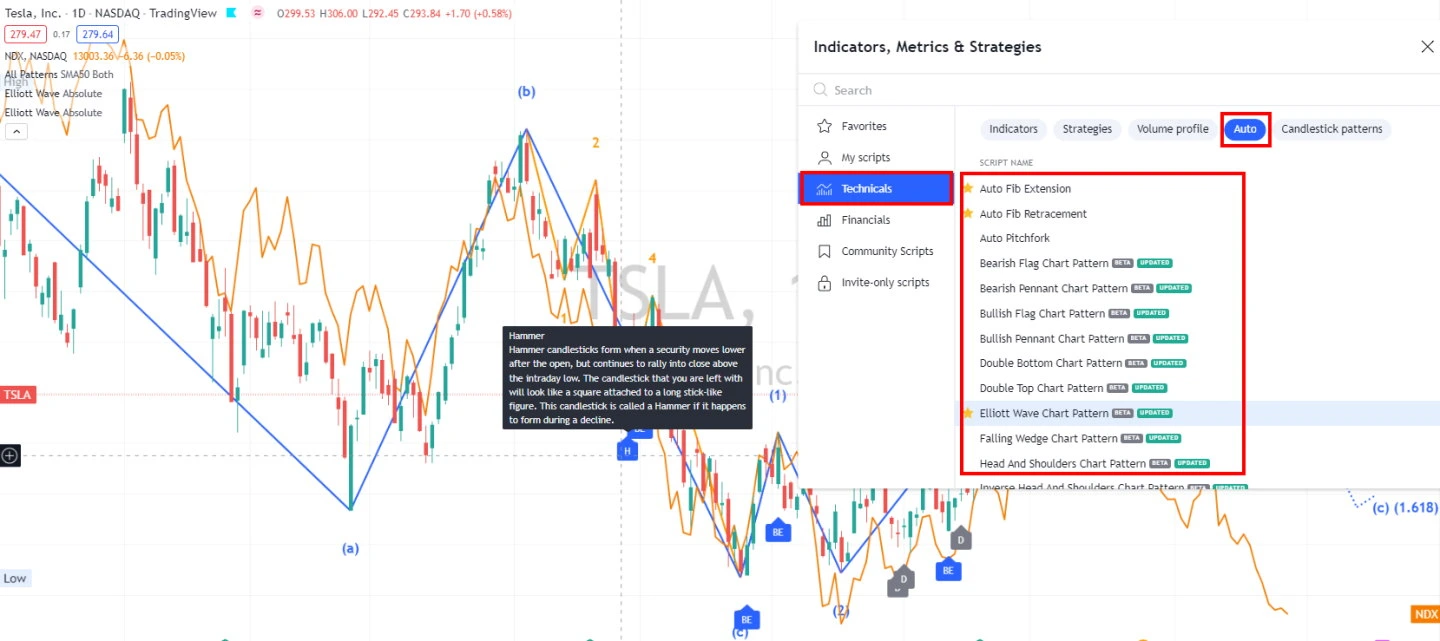
The platform includes a hover‑over help feature that provides detailed explanations for each pattern.
TradingView can detect 16 high‑probability chart structures such as double tops, double bottoms, flags, wedges, and triangles, which can give you an idea of possible future price moves.
TradingView broker integrations
TradingView integrates with more than 50 brokers for trading stocks, futures, forex, and CFDs. In the US, TradingView connects with brokers such as TradeStation and Interactive Brokers for stock trading, while in Europe, you can use integrations with FXCM and Saxo Group for forex and CFD trading.
With TradingView, you can trade stocks and indices worldwide along with all major and minor currency pairs. You can also trade energy products, metals, agricultural futures, and all major cryptocurrencies supported on the platform.
-
Stocks – coverage of around 90% of global stock markets.
-
Forex – all major, minor, and exotic currency pairs.
-
Futures – contracts on energy, metals, agriculture, indices, and even interest rates.
-
Cryptocurrencies – 26 coins including BTC, XRP, and ETH.
-
Bonds – more than 30 types of government bonds.
TradingView FAQ
Is TradingView good for beginners?
Yes, TradingView is a solid choice for both beginners and advanced traders. Although the platform is very powerful, its interface is well designed and intuitive, so it feels much less intimidating than many traditional charting platforms.
Can I use TradingView for free?
Yes, you can use TradingView for free, but if you want to work with more than two indicators or more than one chart in a single layout, you will need to upgrade to a paid plan.
Can I trade BTC on TradingView?
In theory, yes, but only outside the US. You can do this via a CFD broker account. It is “in theory” because CFD brokers will not let you withdraw actual bitcoin to your own wallet; instead, you open a virtual position at the quoted sell price, which “should” track the real market price, much like buying a gold ETF instead of physical gold.
Conclusion
One of the main advantages of TradingView is that you can always track prices for different stocks in real time, from anywhere and on any device. If you need access to technical indicators, financial charts, or trade signal scanners, TradingView offers many excellent free tools to get you started.
The platform is also well organized, which makes it easy to use, and the 30‑day free trial of its premium packages makes trying advanced features quite attractive.
Like any trading tool, TradingView has both strengths and weaknesses, but its benefits appear to slightly outweigh its drawbacks.
P.S. Using TradingView together with Arbitrage Scanner can significantly improve your odds of successful trading.
Want to learn more about crypto arbitrage?
Get a subscription and access the best tool on the market for arbitrage on Spot, Futures, CEX, and DEX exchanges.

You might be interested

EXMO Cryptocurrency Exchange: Official Website Review and Account Login

Huobi (HTX) Crypto Exchange: Full Review and User Guide

Full Review of the Cifra Markets Platform: A Worthy P2P Alternative?
