Triangular Arbitrage Explained: Profiting from Price Gaps Within One Exchange

with ArbitrageScanner!
Triangular arbitrage entails a method of converting one type of asset into another and then back into the original asset, by way of a separate third asset. All these transactions occur on the same exchange, taking advantage of the tiny price discrepancies that exist between three related trading pairs. Because all these transactions occur on one exchange, there are no transfers between exchanges, no on-chain gas fees, and no withdrawal waiting periods.
When people think of arbitrage, they usually think of finding a less-expensive coin on one exchange and finding a more-expensive coin on a different exchange. Although that is one form of arbitrage, it has some friction associated with it because funds must be transferred from where they are located to the desired exchange, the transaction has to be confirmed, network fees must be paid for the transaction, and the price could change before the transfer is completed.
Triangular arbitrage eliminates all of those frictions. Instead of transferring funds from one exchange to another, you only perform your transactions on a single exchange and exploit the temporary price discrepancies between three related trading pairs. Because the transactions are all occurring on one exchange, there are no withdrawal, no on-chain gas, and no chance of transferring. The problem with triangular arbitrage is that these pricing discrepancies are usually very small and may disappear very quickly. It's also possible for the cost of doing the transaction to consume all of the profit if you are not careful.
This article provides a detailed explanation of the concept of triangular arbitrage, includes an example of a numerical calculation using the three legs of the triangular arbitrage process to show how to identify whether there are any pricing gaps, and examines the various costs that can dissuade you from wanting to take advantage of triangular arbitrage opportunities.
What triangular arbitrage actually is
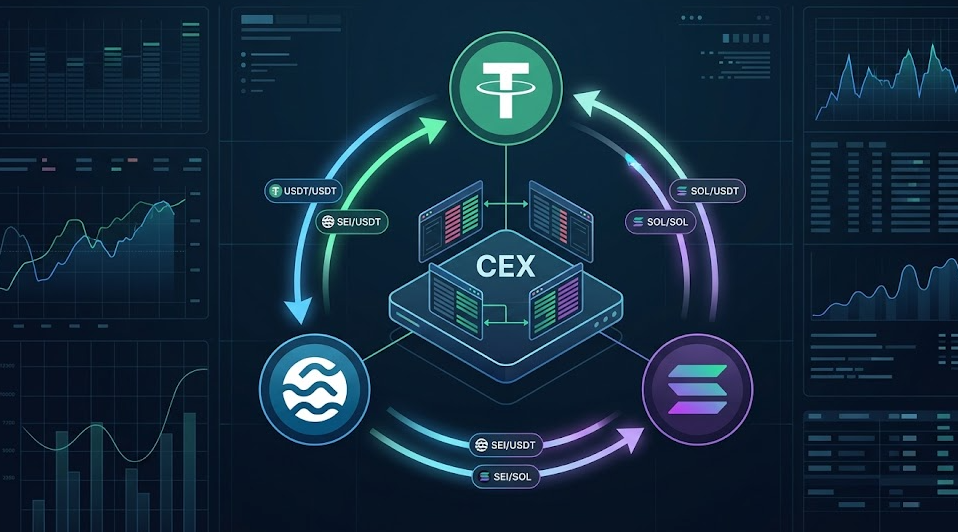
Triangular arbitrage is the process of making profit based on differences in the exchange rates of three different currencies through a cycle of trades. In a complete cycle of trades, you start and finish with the same currency, so it would go:
USDT -> SEI -> SOL -> USDTYou trade USDT for SEI, then SEI for SOL, and lastly SOL back to USDT, with 3 separate orders using the SEI/USDT, SEI/SOL and SOL/USDT trading pairs to complete your cycle.
The three trading pairs all have their own order books, more specifically they all have their own price for each currency pair, and all have their own buyers and sellers who are trading the different currencies with each other through the order book. In general, the prices across the different order books of the different trading pairs tend to stay within a narrow window. When the currency prices become misaligned by a sufficient enough gap or distance for the trading price to drift out of alignment, this creates a trading opportunity to capitalize on it.
Why a mispricing appears at all
When you think of the three different trading pairs, you may visualize they are three different "windows" looking at the same asset. SEI/USDT gives you the value of SEI in dollars. SOL/USDT gives you the value of SOL in dollars. SEI/SOL gives you the value of SEI in SOL terms.
If the prices from each of those windows agree, then you cannot capture value. The first two prices provide value to the third price. When there is a disparity, the SEI/SOL price that is directly quoted does not agree with the value coming from the SEI/USDT and SOL/USDT.
What might cause those values not to agree? Order books are updated independently based on their own flows of orders. An independent large buyer might buy at SEI/USDT and cause movement in the market before the same buyer updates the SEI/SOL order book; the same could happen with a market maker updating one of the three pairs. There are many events around Mid-June 2026 that could cause this discrepancy: SPK has a 27% supply unlock on June 17, KAITO unlocks approximately June 20 and both ARB and SEI unlock in the middle of the month. Unlock events tend to increase volume in particular pairs and increased and skewed volume with a lot of action creates the environment to cause all three prices to go out of alignment.
The math: implied cross-rate versus quoted cross-rate
Triangular arbitrage works by comparing an implied cross-rate to a quoted cross-rate.
Let's assume at a point in time you see:
- SEI/USDT = 0.300 (1 SEI = 0.300 USDT)
- SOL/USDT = 150.00 (1 SOL = 150.00 USDT)
Using this data you can calculate the implied SEI/SOL price as follows:
Implied SEI/SOL = (Value in USDT of 1 SEI) / (Value in USDT of 1 SOL)
= 0.300 / 150.00
= 0.00200 SOL per SEI
So a price of 0.00200 SOL is to be expected on the SEI/SOL book. If both prices show 0.00200, there was no movement in price as represented by the two data sets. Assume the SEI/SOL books price was 0.00204 for just a brief moment; this means that each SEI that you exchange will yield more SOL than when using USDT for your trade. That is the gap from one market to the other is 2% (0.00204 - 0.00200) in cross-rate. The only step left is to perform a loop, buying SEI on the USDT side and closing the trade back to USDT with the SOL.
Many would view this as an unusual arbitrage opportunity. The remainder of this article will illustrate the effects of transaction costs as they may limit this opportunity.
A fully worked three-leg example
Now, let’s use an example of how you would execute an arbitrage opportunity from beginning to end by taking real examples and including the costs associated with the transaction. The objective is to complete the arbitrage opportunity and not incur a loss on your position due to slippage.
For illustrative purposes, let’s assume the following trades will take place compared to our original $10,000 USDT starting capital (representative numbers only) at a flat maker fee of 0.10% to each trade, and we are ignoring slippage so we can illustrate step through each leg of the three-leg arbitrage.
Quoted prices as of the time of the trade:
- SEI/USDT = 0.3000
- SEI/SOL = 0.002040 (implies increased value on SOL leg)
- SOL/USDT = 150.00
Leg #1 - Purchase SEI using your USDT.
$10,000 USDT / 0.3000 = 33,333.33 SEI - 33,300.00 SEI (0.10% fees)
Leg #2 - Sell SEI to receive SOL.
33,300.00 SEI x 0.002040 SOL = 67.932 SOL - 67.864 SOL (0.10% fees)
Leg #3 - Sell SOL to close out your USDT position.
67.864 multiplied by 150 equals to 10,179.60, less 0.1% = 10,169.42 USDT
Result: This means that 10,169.42 will be the amount in the account versus starting with 10,000.00 - resulting in a gain of 1.69% in this idealized scenario.
If the SEI/SOL book was priced correctly with an implied cross rate of 0.002000; Leg two would yield 66.6 SOL rather than 67.9; Leg three would yield approximately 9,970 after three legs plus fees yielding a loss of below 10,000. This presents the critical understanding when the cross rate is close to correct, the informational loop yields fees continuously. The entire gain from the cross rates will exist only as long as there is a significant distortion; when there is a minor distortion the equalizing will occur outside of the loop, therefore there will be no net gain from the cross rates.
In reality, a 2% difference in cross rate between the active pair of two liquid instruments is great and uncommon. Rates between two instruments after fees generally run in the 0.1% - 0.3% range, and will occasionally run between 0.5% - 0.8% during extreme market volatility. The example above is to illustrate the arithmetic only.
The costs that decide everything
Fees are the determining factor for paper vs real profits. The three items to differentiate a paper profit loop from a real profit loop are fees, slippage & bid/ask spread.
Accumulated fees exist across all three legs of a loop; a taker fee is created on each leg; thus, the break-even point should be approximately three times the per trade fee. The table illustrates the impact the one variable has on a loop with no slippage:
| Per Trade Taker Fee | Total Fee Drag (3 Legs) | Cross Rate Gap Needed for Break Even |
|---|---|---|
| 0.00% (Maker Rebated) | ~0.00% | Any positive gap |
| 0.075% | ~0.225% | Gap must be >~0.225% |
| 0.100% | ~0.300% | Gap must be >~0.300% |
| 0.200% | ~0.600% | Gap must be >~0.600% |
| 0.400% | ~1.200% | Gap must be >~1.200% |
It’s easy to see why the fee tier matters; at the most common fee of 0.100%, almost all cross rate gaps <0.300% have already disappeared before taking into account anything else. Fee tiers are important to traders doing these types of loops as the bulk of trades are typically done using volume discounts and many will try to execute at least one leg using a Maker order; however, placing a Maker order during the loop could run the risk of execution.
Slippage occurs on thin legs. The worked example assumed the entire size would be executed at the quoted price. Most of the time that isn’t true. The leg in the middle of this loop (SEI/SOL) is generally going to be the thinnest of the three legs, as alternate-to-alternate pairs will have much less liquidity than the USDT pairs. If your order pushes down the book enough while being executed, you will end up with a realized rate that is much farther away from the quoted top-of-the-book rate and thus eliminates most of the cross rate gap. Additionally, the smaller and thinner the middle leg, the greater the slippage will be.
Spread – Three passes across the bid-ask spread will incur a cost associated with those trades and be solely dependent upon the Taker execution type. For a Taker executing in a tight and liquid book, the cost from crossing the bid-ask spread will be negligible, while in a thin or fast-moving book, the cost could be greater than the taker's fee.
Why speed and automation matter
Importance of speed and automation: These opportunities are not merely small in size, but rather are very fleeting. The same market participants performing arbitrage and who keep all three books aligned with one another at any point can see the same dislocations and the gap may close as quickly as 1-2 seconds.
By the time a human can identify a price discrepancy, calculate an implied cross-rate, and submit three orders with a click of the mouse, the opportunity has almost invariably disappeared; furthermore, if a partial execution occurs, then the trader will find themselves holding the asset in the middle at a worse price than they had estimated.
This is why serious triangular arbitrage is a speed and monitoring issue. You will need to perform ongoing calculations and comparisons of the implied cross rates of multiple groups/pairs of three assets, mark the groups with quoted rates that diverge enough to cover costs and slippage from your transaction, and execute your trades before the book re-synchronizes. Attempting to manually monitor dozens of crypto-currency assets to find trading loops will not work as there is real value in having tools that can quickly and continuously scan many crypto-pairs and get you the loops that are actually profitable.
Triangular vs cross-exchange vs DEX
Understanding the triangular arbitrage option in comparison to its two related forms. It will be helpful to understand how the triangular arbitrage strategy fits into the broader category/types of arbitrage opportunities. The two other variations of arbitrage are:
Cross exchange arbitrage - purchase a cryptocurrency on one trading platform and sell it on another platform; benefits of this strategy include larger price variations between exchanges and longer durations of time for which those price discrepancies exist, drawbacks to using this strategy include: transfer risk (moving funds from one exchange to another), withdrawal/network fees, and waiting for the price movement between when you initiate a transaction and the time it is completed. Triangular arbitrage eliminates transfer friction by conducting trades instantaneously within one account while effectively closing larger gaps in exchange.
When conducting triangular arbitrage on a decentralized exchange (DEX), the transaction routes liquidity pools instead of using order books. There are two major differences in how order books and liquidity pools work: First, with every trade (swap) on a DEX, you will pay on-chain gas fees – which means that small loops will always be unable to pay those costs, as the fees create a floor from which a small loop cannot rise. Second, with larger trades (swaps), the price of the liquidity pool will slightly rise due to price impact (the price at which a trade occurs) resulting in additional fees, thus potentially rendering a trade to fail (or get front-run) in addition to increasing the risk of additional slippage due to the price impacting your trade price.
As a result of these factors, the triangular arbitrage loop on a CEX (centralized exchange) is three trades (one for each leg) with no gas fees and almost instant settlement, thus making triangular arbitrage between exchanges a generally low-friction method of executing a triangular arbitrage strategy using this process, compared to the CEX triangular arbitrage strategy which uses much tighter closing gaps in a relatively short time frame.
Where a screener fits in
The practical difficulty is detection. An opportunity to capture an arbitrage dislocation may occur for just a moment between any of the numerous possible three-pair trading loops, however, there are only a handful of three pairs that have sufficient liquidity and acceptable slippage for your size of order; therefore, an individual user will only have to look at those few three-pair loops, but a computerized trading system designed to watch order books, recalculate implied cross-rates each time the price changes, and filter only for net-positive results can successfully find arbitrage opportunities for many thousands or tens of thousands of users simultaneously.
Our tools
Arbitrager provides an ecosystem of professional tools to resolve the problem of continuous monitoring and discovery of arbitrage opportunities. The Arbitrager screener tracks the pricing of over 80 exchanges, 25+ DEX's and over 40 blockchain lines, with market-stabilized backup markets continuously updating once per second. In addition, you will have access to a historical pricing spread chart so that you can evaluate how frequently and how wide a specific price gap has historically occurred before risking your capital. Your funds are always under your control as the bot will always have direct access only.
For understanding the screener mechanics, refer to the arbitrage screener and arbitrage scanner/bot. Supported exchanges provide comparisons on coverage and fee tiers between exchanges and explain differences.
Frequently Asked Questions
What does triangular arbitrage mean simply?
Triangular arbitrage constitutes a loop of 3 trades on one exchange whereby you convert from trade A to trade B to Trade C, and finally back to Trade A. To generate profit, the price alignment between the three pairs needs to not be seen as equal. If you successfully complete the loop, you will have more of asset A at the end than you started with prior to factoring in transaction costs.
What formula calculates if an opportunity exists for triangular arbitrage?
In the case of examples with SEI/USDT and SOL/USDT, you would divide one price out of the other to identify the implied cross rate for a third pair (SEI/SOL). You will then compare the implied rate with the price that has been quoted directly for SEI/SOL. If you determine the difference is greater than your expected fees (combined) plus your expected slippage, there may be an opportunity for a profitable loop to occur.
Why are the profits from carrying out triangular arbitrage transactions very low?
As all three order books are being constantly arbitraged back to their proper price alignment by different participants. The gaps that you can take advantage of are normally very small; typically between 0.3% and 0.8% with three separate sets of taker fees and slippage reducing these amounts even further. After accounting for all the aforementioned costs, the net edge that you actually have left over could easily be less than half of one percent!
Is triangular arbitrage more secure than cross-exchange arbitrage?
By using triangular arbitrage, you are eliminating many risks associated with transferring funds between exchanges such as withdrawal fees, network gas fees, and price drift while your funds are in transit as they will remain in your account until completed. You are still exposed to execution risk as the price of the first or last leg may be worse than the price quoted and you wind up owning the second leg(s) of the trade.
Can I manually engage in triangular arbitrage trades?
Sure, you can manually place your orders; however, manually searching for potential gaps would be very time-consuming due to the speed that these opportunities close up. Most of the manual work surrounding triangular arbitrage comes from finding the opportunity through the use of an automated program that is continually scanning numerous pairs and then pulling out only those that will yield a profit after taking into account transaction costs, while still leaving the decision to execute up to you.
Why do token unlocks result in increased opportunities for arbitrage?
When a token unlock event occurs, the majority of the trading volume for a specific token pair is concentrated around that event in a short amount of time (and therefore price movement is increased) causing one or more of the three books to lag behind for a short period of time. June 15, 2026 is an example of an event where the unlocked tokens (SPK, KAITO, ARB, SEI) provided numerous short-term opportunities to take advantage of mispriced assets as the tokens have significantly different values due to being unlocked together.
Try out ArbitrageScanner free for one day and get access to the entire suite of crypto arbitrage tools and scanning multiple pairs across 80+ exchanges every second!
The information contained in this article is for educational purposes only, is not intended as investment, trading or financial advice; nor should be relied upon by the reader as a basis for entering into any transactions in connection with trading cryptocurrencies or any arbitrage strategies. All examples presented were for illustrative purposes only and do not depict actual prices, nor are they guaranteed to achieve a particular result or return. All fees and liquidity are variable as to time and location of execution and historical performances do not provide guarantees on future trading results. ArbitrageScanner was developed and is operated as a completely manual trading platform and does not have an API investor connection to your accounts; therefore, you will maintain full control of your assets. You are strictly advised to do your own due diligence before risking any of your money.
Want to learn more about crypto arbitrage?
Get a subscription and access the best tool on the market for arbitrage on Spot, Futures, CEX, and DEX exchanges.

You might be interested
ENA Catalyst Rally: Reading On-Chain Signals Before the 20% Move
Hyperliquid–CEX Funding Arbitrage on Long-Tail Perps Explained
Sandwich-Proofing Your DEX Swaps: A 2026 MEV Protection Playbook
