Understanding Crypto Support and Resistance Level
with ArbitrageScanner!
Support and resistance levels in cryptocurrencies: a complete guide
Cryptocurrency trading requires a deep understanding of market mechanisms, especially when it comes to technical analysis. One of the key elements of this analysis is support and resistance levels. They help traders identify potential entry and exit points, as well as manage risk. These are the most basic indicators for interpreting information from the chart, and newcomers to trading will find it easier to understand the market situation.
In this article, we will take a deep dive into the essence of these concepts, learn how to recognize them and apply them to make more informed decisions in the cryptocurrency market.
What is a support level?
A support level is a price below which an asset (in our case, cryptocurrency) does not usually fall. It's like a “floor” on a chart that limits the price decline. When the price approaches the support level, buyers become interested, which leads to an increase in demand and stabilization of the price
Let's explain with an example: imagine you are climbing a sturdy ladder. Each step is a support level that will not let you fall, because it is strong enough. It is the same with the support level: if it is suddenly broken, it will indicate a strong correction in the market.
Reasons for the formation of support levels
These levels arise due to the mass psychology of market participants. Traders memorize certain prices where they have already made transactions or seen significant activity. For example, if bitcoin has tested the $90,000 level several times and bounced off it each time, many participants will begin to perceive this price as an important barrier, i.e. a support level below which the price of the main cryptocurrency has not fallen recently.
What is a resistance level?
A resistance level, on the other hand, is a “ceiling” above which the price usually cannot rise. Here, sellers become active, creating pressure on the market that prevents further growth.
Example: in January 2025, bitcoin tested the $105,000 level and above several times, but was never able to overcome it and gain a foothold. This level has become a strong resistance until then and will remain so until buyers outnumber sellers.
Reasons for the formation of resistance levels
Like support levels, resistance levels are created due to the actions of traders. Sellers tend to lock in profits at known high points, and new market entrants may not be willing to pay more than what was previously established.
However, when comparing support and resistance levels, things are a bit more complicated in the latter case, especially at times when price is updating historical highs. For example, since November 2024, bitcoin went into an active growth stage, updating ATH several times a month. At this point, it was not clear to market participants where the resistance level was (i.e. where market participants would want to start taking profits). And only in January 2025, it became clear that the current resistance level of bitcoin is at $105,000-107,000, because this is the range the asset has tried to pass several times, but so far without success.
How does trading history affect the formation of support or resistance levels?
Historical data plays a huge role. The more times the price has tested a certain level and bounced off of it, the stronger that level becomes. For example, if bitcoin reached the $90,000 level for a few months and each time buyers stepped up, that level would become a strong support zone. It can be said that this level will remain this level for many years to come: market participants often refer to historical data in times of high volatility.
How is level strength measured?
The strength of a level in the financial market is determined by how often it is tested and by trading volumes. When bitcoin repeatedly approaches the $107,000 level but cannot overcome it, it forms a strong resistance as sellers actively defend this price point. The more such attempts, the more significant the level becomes.
The situation with support is the opposite: if the price often falls to the level of $90,000 and consistently bounces upwards, it indicates the stability and willingness of buyers to defend this range.
However, trading volumes play an important role - with low volumes levels can persist for a long time, while high volume on a breakout reduces the significance of the level and can turn resistance into support and support into resistance.
How does psychology affect the formation of levels?
Cryptocurrency market prices move not only because of fundamental factors such as news or macroeconomic indicators, but also because of the massive psychology of market participants. Traders expect the price to move within certain limits based on previous experience. These expectations form support and resistance levels.
When most traders believe that the price will not fall below a certain level, they start buying to protect their positions. This creates additional demand that reinforces the support level. Similarly, if the majority believes that price will not be able to overcome a certain level, sellers increase pressure, making that resistance level more solid. To determine the mood of traders, you can use our sentiment tool.
You also need to take into account FOMO - the lost profit syndrome. Let's look again at the bitcoin example: the beginning of the asset's rise in November 2024 attracted many investors and traders who had no open positions or investments in it. However, watching it grow, most wanted to get involved and therefore entered trades far from the beginning of the growth, thus increasing trading volume. As it was said earlier, the levels break through when the trading volume of the asset increases, however, as historical practice shows, after that the price goes into correction, leaving new investors with losses. Therefore, FOMO can also play an important role in overcoming support or resistance levels.
Peculiarities of the cryptocurrency market
The cryptocurrency market is characterized by high volatility, so support and resistance levels can change quickly. Take, for example, gold: in it, the formed support and resistance levels remain so for months or even years. As for cryptocurrencies, everything is much faster, especially in coins with small capitalization: levels can change every day, because of which the informativeness suffers, but still remains one of the main indicators for trading.
Unlike traditional financial markets, cryptocurrencies are traded 24/7. This means that support and resistance levels can form faster and be less stable. Additionally, news events such as regulatory decisions or major investments can significantly affect the strength of these levels.
How does volatility affect the performance of levels?
High volatility can cause support and resistance levels to become less reliable. For example, if the price of bitcoin fluctuates over a wide range, historical levels can be easily broken even if they seem solid.
Finding support or resistance levels
Highs and lows
Finding support and resistance points is often done by analyzing the highs (highs) and lows (lows) on specific time frames. Highs indicate maximum price values in an uptrend phase, while lows indicate minimum price values in a downtrend.
When a particular asset shows sustained lows and highs, they are called strong support and resistance levels.
Moving Average
A popular tool for getting up-to-date information on a particular asset. Market participants use different types of moving averages to identify both long-term and short-term points of support and resistance. The most commonly used variants include moving averages with periods of 10, 20, 50, 100 and 200 days.
In crypto trading, moving average indicators help traders filter out unnecessary information and focus on significant trends. For traders looking for quick profits, shorter moving averages (e.g. 10, 20 or 50 day periods) are more effective, while longer moving averages are suitable for long-term investors.
Trend Line Indicator
A trend line resembles the support and resistance levels we see on charts, only instead of horizontal lines, sloping lines are used here.
And here is how the trend line is formed:
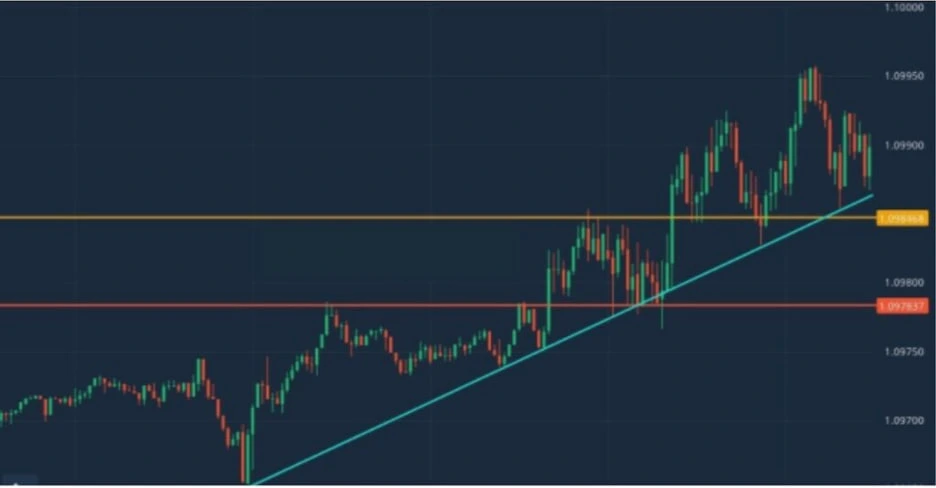
The trend line demonstrates a level of support throughout the chart. A parallel line passing through the peak prices will serve as a resistance level. When drawing trend lines, it is important to pay attention to the key price points (2-3) for the period in question. This will allow you to draw two parallel trend lines, if necessary, to mark an area for trading.
Round Numbers
Round numbers are key psychological price levels, often ending in 0, such as $90,000 or $95,000. As a general rule, people mostly think in round numbers, not just in relation to the financial markets. Round numbers are easier to visualize than 95,347, for example. That's why when the price of an asset goes into a rising or falling phase, market participants pay attention to round numbers. For example, if bitcoin now overcomes the level of $109,000, then the next significant mark after will be $109,500, then $110,000 and so on.
To determine the support or resistance level of a cryptocurrency, you first need to find the round numbers in the already formed levels. These differ for different assets depending on their price history and volatility. After identifying these levels with round numbers on the chart, it will become clear where the price most often bounced from: it is this mark that will be considered a strong support or resistance level.
Conclusion
Support and resistance levels are key factors that determine a trader's profit or loss in every trade. However, being able to recognize these levels is a critical skill for a trader. Also, in the early stages, you can resort to mentoring: experienced traders do not mind increasing their own income by teaching newcomers to the market. However, there is a lot of scam in the market, especially in mentoring. We encourage you to read our comprehensive training on onchain analysis, cryptocurrency arbitrage and cryptocurrency markets in general.
It is important to remember that these indicators show a dynamic picture, allowing you to lock in profits and make trades in the current moment, but they will adjust with each breakout. Knowing how to identify these indicators will help you maximize your profits.
Want to learn more about crypto arbitrage?
Get a subscription and access the best tool on the market for arbitrage on Spot, Futures, CEX, and DEX exchanges.

