Japanese Candlestick - How It Works, Patterns, Overview
with ArbitrageScanner!
Candlestick Analysis or Japanese Candlesticks
Why does candlestick analysis have roots from Japan?
In the seventeenth century, one of the main commodities was rice. In that century, the Japanese already had a stock exchange for trading rice. This became the impetus for the creation of a school of Japanese candlesticks technical analysis to measure rice price fluctuations!
Thus, it was in Japan that the first exchanges in the world appeared. Although many mistakenly believe that the predecessors were in New York.
The first mention of candlestick patterns was by a Japanese rice trader - Homma Munehisa in the 1700s.
A couple of centuries later, in the 1990s, Steve Nison - a trader and analyst, studied and began to apply the ancient Japanese technique. Subsequently, the entire Western world became familiar with the "Japanese candlesticks" technique.
To this day, the technique of Japanese candlesticks is one of the most popular, and the entire world of trading uses it.
Japanese Candlesticks: Basics Part 1
Japanese candlesticks - a popular way to read price movements on charts
Each candle has four facts about itself:
- open price;
- high;
- close price;
- low.
Bullish candle - price rises and, accordingly, bearish - price falls.
Candle body - the space between the candle's open and close.
- If the body is green/white, the closing price is higher than the opening price;
- If the body is red/black, the closing price is lower than the opening price of the candle;
- Candle shadows - the highest and lowest points reached by the candle.
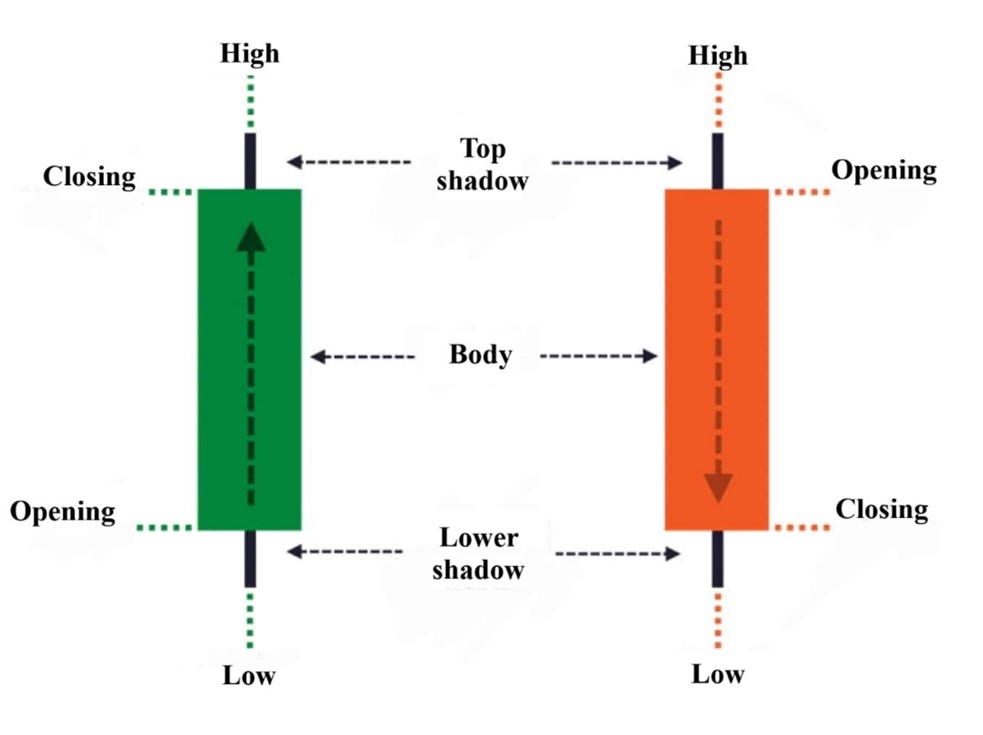
Fig. 1 - "Japanese candlesticks brief information"
Japanese Candlesticks: Basics Part 2
Each candle represents a selected timeframe (time interval). For example, on 4-hour charts, candles open and close every 4 hours and so on.
The undeniable advantage of Japanese candles is informativeness. Below are two identical charts, but it is obvious that on a linear chart, we cannot confidently say that we have enough information to make an investment decision.
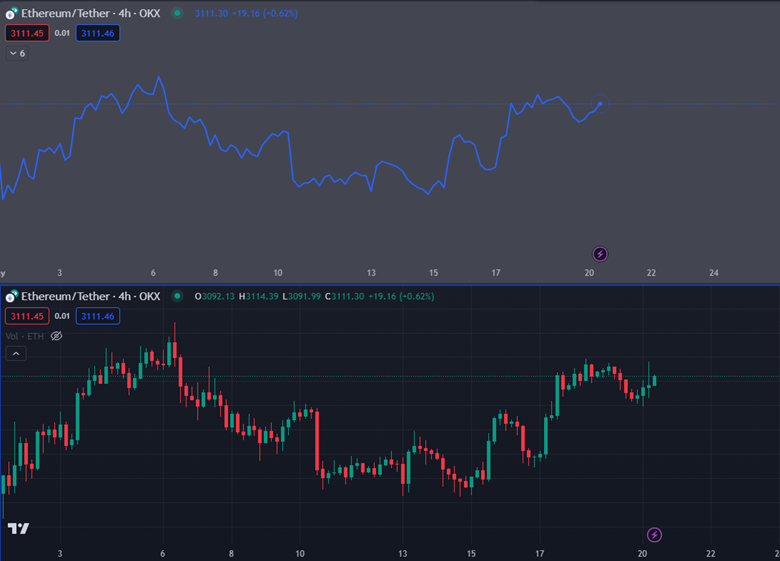
Fig. 2 - "Comparison of linear and candlestick charts"
At the same time, a candlestick chart gives us a hint that the area of interest does not fall below the extreme (minimum) of the first candle.
A trader or investor who analyzes and interprets candlestick patterns or models already understands the market sentiment a little better, which allows making prudent investment decisions.
Japanese Candlesticks: Basics Part 3
All Japanese candles look like a line when opened - Fig. 3.

Fig. 3 - "Candle when opened"
Line - a new candle that will be given movement. Without insight, hardly anyone can predict for sure where it will go.
Correctly, the candle is an indicator showing who is winning the standoff.
Bullish candle (Fig. 4): buyers' strength prevails. As long as there are more buys, bullish pressure remains higher.
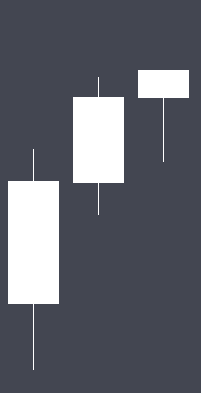
Fig. 4 - "Bullish candles"
Bearish candle (Fig. 5): sellers' strength prevails. As long as there are more sells, bearish pressure remains higher.
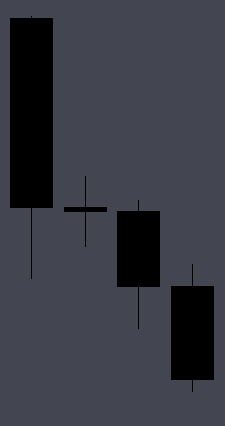
Fig. 5 - "Bearish candles"
Candle shadows aside from extremes also provide a lot of information.
A small lower shadow, a small bearish body, and a large upper shadow (Fig. 6): bulls tried to push the price, but at closing, bears pushed the price back down and gained an advantage.
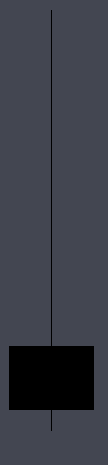
Fig. 6 - "Pattern: bearish pin bar"
A large lower shadow, a small bullish body, and a small upper shadow (Fig. 7): bears pushed the price down, but at closing, bulls pushed the price back up and secured the advantage.

Fig. 7 - "Pattern: bullish hammer"
HOW TO UNDERSTAND JAPANESE CANDLESTICKS?
Price movement in financial markets = a showdown between buyers and sellers.
To understand Japanese candlesticks, keep three factors in mind:
- Candle color: indicates who controls the situation - bulls or bears. (Fig. 8)
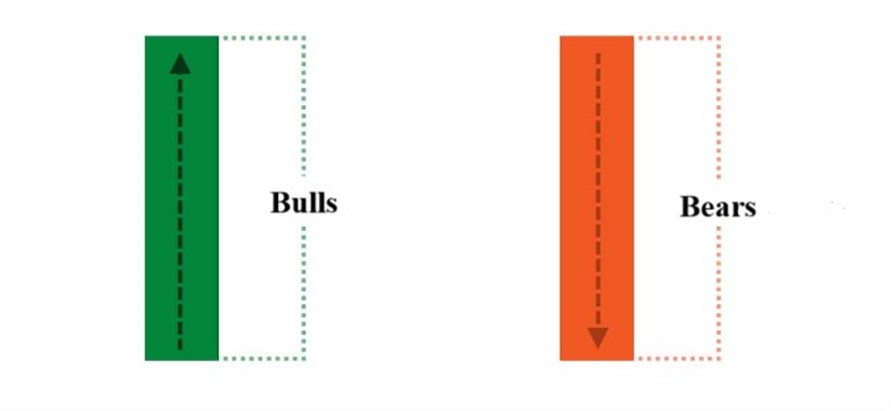
Fig. 8 - "Bullish and bearish candles"
- Length of shadow (wick): indicates price rebound from a certain level. (Fig. 9)
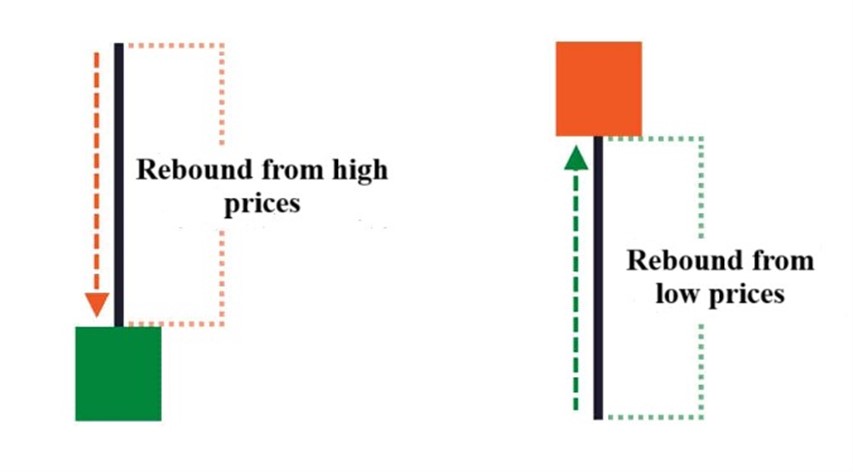
Fig. 9 - "Price Bounces"
- Body size: indicates buyer or seller strength in the moment.
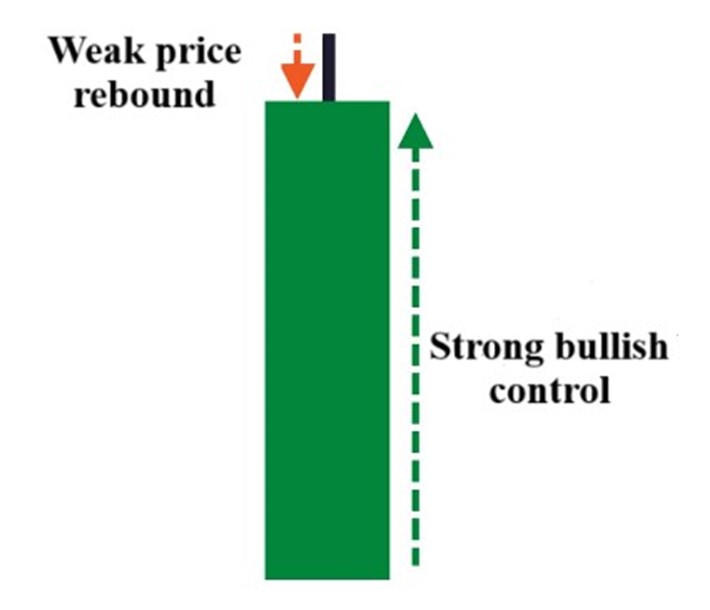
Fig. 10 - "Strong Buyer"
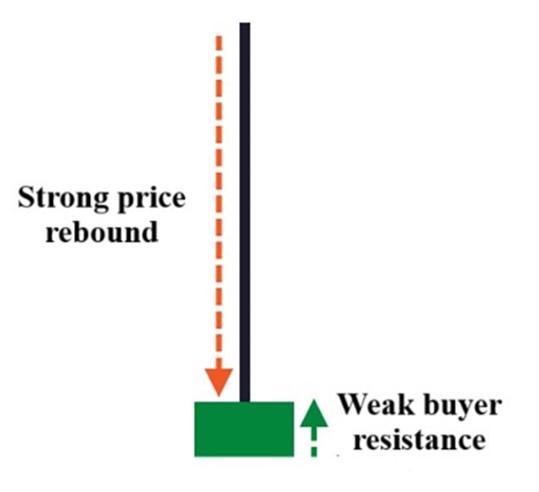
Fig. 11 - "Strong Seller"
By combining these three factors, we can fully interpret Japanese candlesticks on the chart.
It's not necessary to memorize all candlestick patterns. The most important thing is to use candles, along with other tools, to read the chart correctly in order to make informed trading decisions.
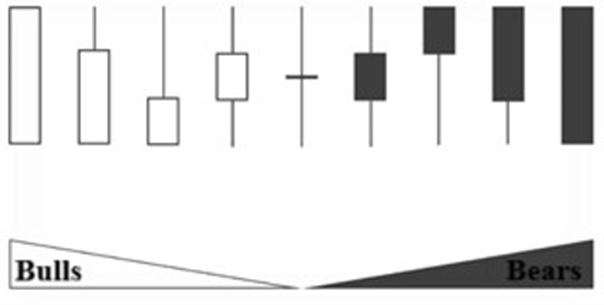
Fig. 12 - "Bullish and Bearish Candles"
JAPANESE CANDLESTICK PATTERNS
All candles presented earlier are mirror images of each other. However, this is not an exhaustive list, just the foundation.
Let's consider the following candlestick patterns:
- Doji - long shadows and a small body = market uncertainty (Fig. 13). The higher the shadows, the greater the bull and bear standoff. When the candle has no body, and the shadows are short = complete market uncertainty (Fig. 14).

Fig. 13 - "Doji Candle: Market Uncertainty"
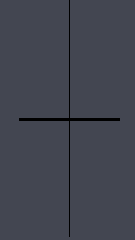
Fig. 14 - "Doji Candle: Complete Market Uncertainty"
- Pin Bar - a candle that bounces off its max or min, where one shadow is very short or nonexistent, and the other is two to three times longer = reversal pattern. (Fig. 15).
!!! NOTE: Confirmation from several factors is required to confirm that a reversal has occurred.

Fig. 15 - "Pin Bar Candle"
- Engulfing - also a reversal pattern, where the second candle is opposite to the first and engulfs it with its body. Initially, the price was driven by sellers, but then the initiative passed to buyers, where buyers completely overwhelmed the bears. (Fig. 16).
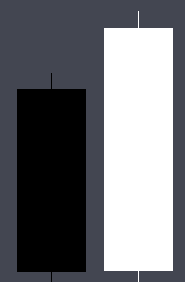
Fig. 16 - "Engulfing Candle"
- Cloud Cover - a formation similar to engulfing but indicates an even sharper price reversal. Trigger (reason) - news, events, etc. (Fig. 17).
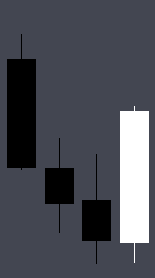
Fig. 17 - "Pattern: Cloud Cover"
- Tweezers - a formation where candles hit the same level with their shadows = there is a strong level that the price is unlikely to go below or above. (Fig. 18).

Fig. 18 - "Pattern: Tweezers"
- Morning Star - a formation of three candles, where eventually the buyer will prevail: the first candle is a full-bodied bear, the second candle is uncertain, and the third is a bullish with a long body. (Fig. 19).

Fig. 19 - "Pattern: Morning Star"
- Three Candles - a continuation pattern that indicates that the price is likely to continue its movement in the same direction, starting with a full-bodied bullish candle, followed by three small bearish ones, and the fifth candle bullish with a body higher than the previous three. (Fig. 20)
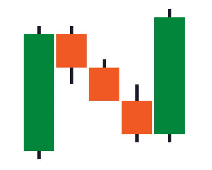
Fig. 20 - "Continuation Pattern: Three Candles"
- Inside Bar - the most popular continuation pattern, indicating. When an inside bar appears in a trend (upward or downward), it means that there was a pause, after which the price is more likely to continue moving in the same direction. (Fig. 21)
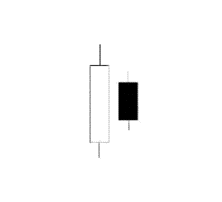
Fig. 21 - "Continuation Pattern: Inside Bar"
Thus, studying Japanese candlesticks is a powerful tool for market analysis. It originated in Japan in the 17th century based on rice trading and has since become popular worldwide. The main idea is to analyze price movements through the shape and color of candles. This method allows traders or investors to better understand market sentiment and make informed decisions. Additionally, studying Japanese candlestick patterns helps identify possible entry and exit points from the market.
!!! NOTE: The information in this article is purely informative. All trading decisions are made based on several factors and tools. Keep this in mind while working!
Want to learn more about crypto arbitrage?
Get a subscription and access the best tool on the market for arbitrage on Spot, Futures, CEX, and DEX exchanges.

