Detailed Guide: How to get started wth Anomaly Detect
What is Anomaly Detection?
Anomaly Detection is a service that helps identify which trades were abnormal for a specific wallet in relation to its entire transaction history.
The service detects 7 types of anomalies:
- Time intervals for making trades:
-
This type of anomaly looks at the frequency of trades within specific time intervals: from midnight to 4 AM, from 4 AM to 9 AM, and so on. If a wallet usually doesn’t trade during a certain time period but starts doing so suddenly, it is considered an anomaly.
-
- Gas costs:
-
This type of anomaly examines the gas fees incurred by the wallet during trades. If the gas fees for a particular trade were significantly lower or higher than usual, it is considered an anomaly.
-
-
Max priority gas costs:
-
This type of anomaly examines the costs of accelerating a transaction (such as a "swap") incurred by the wallet. If the acceleration costs for a specific swap were unusually low or high, it is considered an anomaly.
-
-
PNL:
-
This type of anomaly looks at the change in the wallet's PNL after a trade. If the PNL increased or decreased significantly following a particular swap, it is considered an anomaly.
-
-
Trade volume in dollars:
-
This type of anomaly examines the trade volume in dollars. For example, if the wallet usually executes swaps worth ~$1000, but suddenly trades for $10,000 or $10 (a significant volume change in either direction), this is considered an anomaly.
-
-
Spread to trade volume ratio:
-
This type of anomaly looks at the ratio obtained by dividing the spread (the percentage difference between the buy and sell prices of a token) by the trade volume in dollars. A significant change in this ratio in either direction is considered an anomaly.
-
-
Gas to trade volume ratio:
-
This type of anomaly looks at the ratio obtained by dividing the gas fees incurred during a trade by the trade volume in dollars. A significant change in this ratio in either direction is considered an anomaly.
-
How to start using Anomaly Detection?
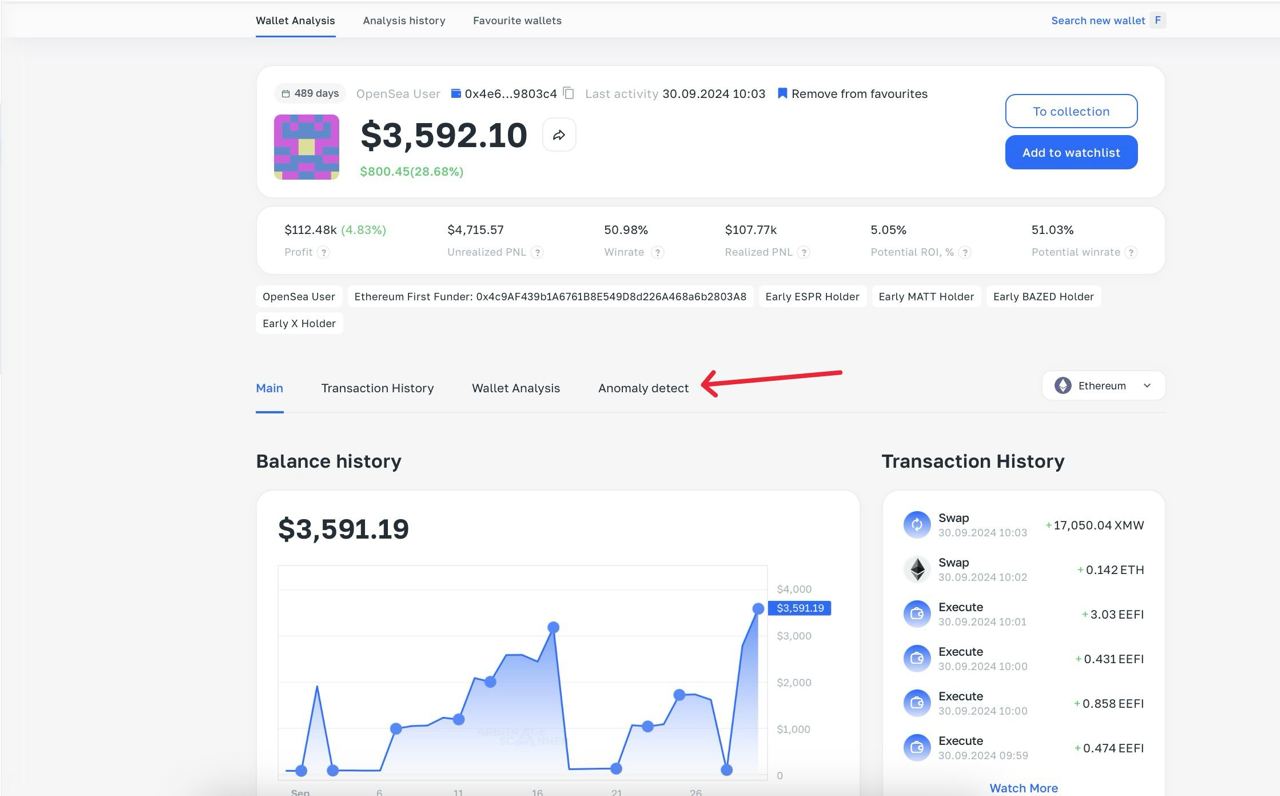
To use the Anomaly Detection service, go to the "Anomaly Detection" tab within the wallet analysis section:
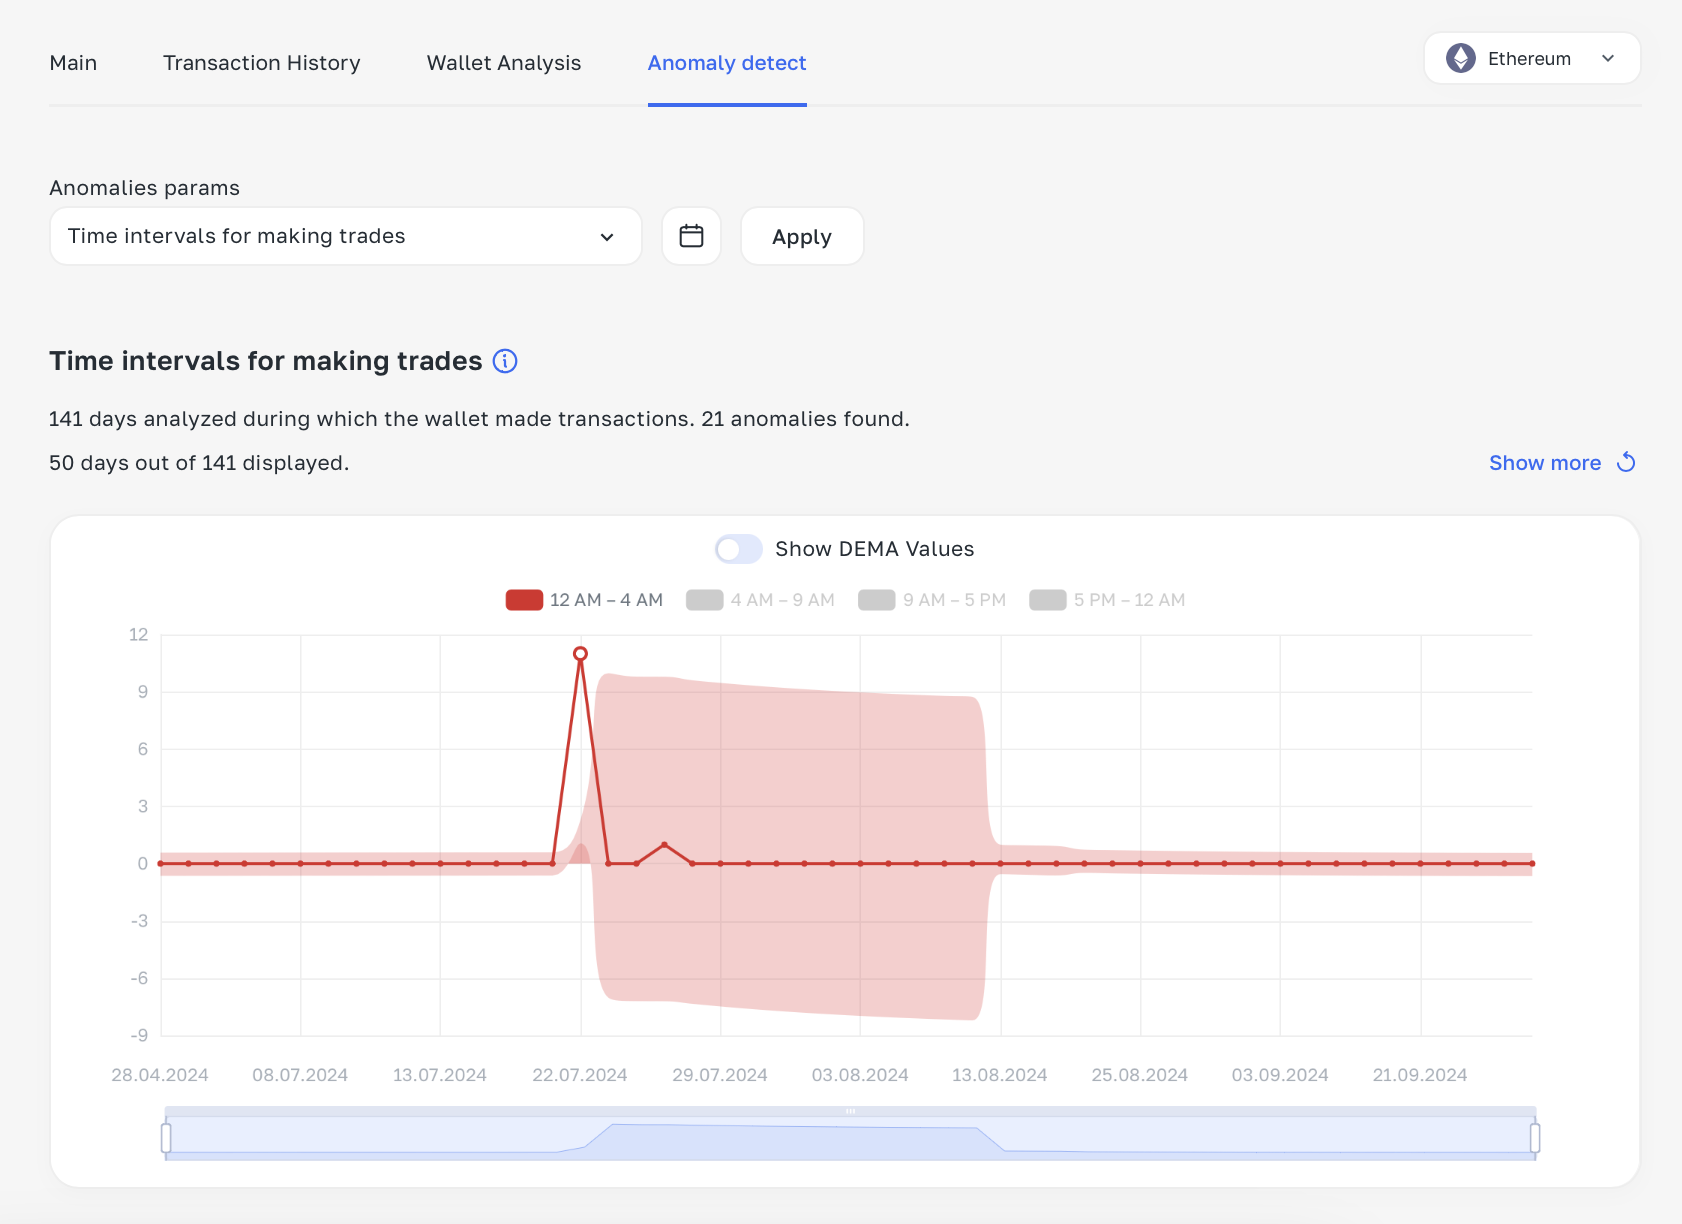
Once you enter this tab, you will see the settings panel and the default display of anomalies for the first automatically selected type:
Let’s take a closer look at the buttons:
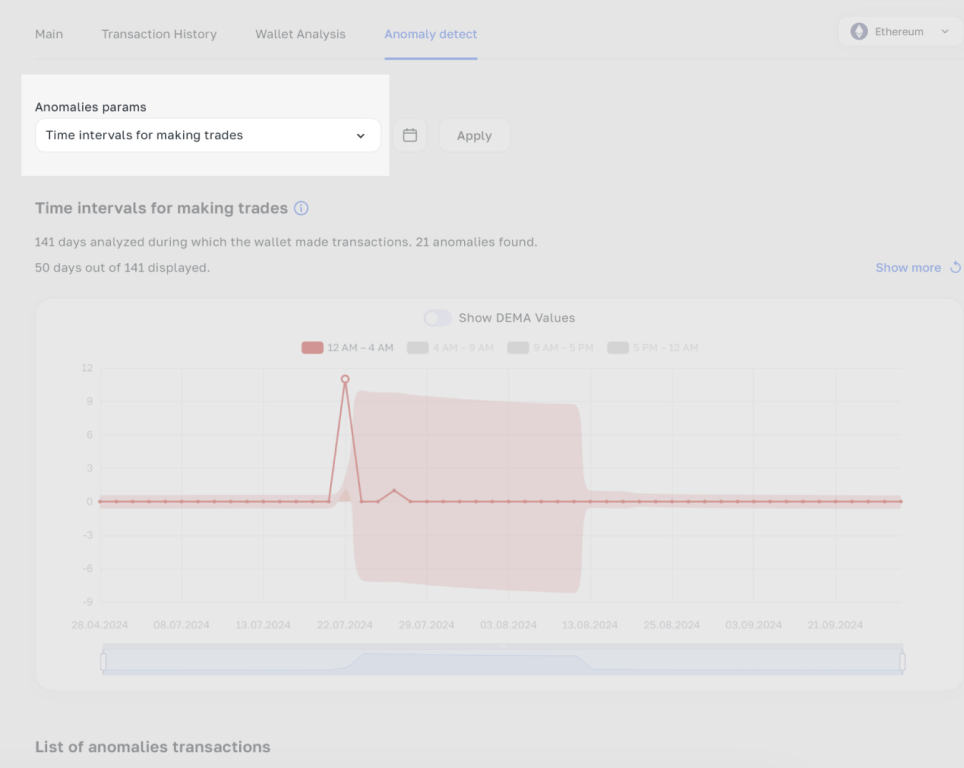
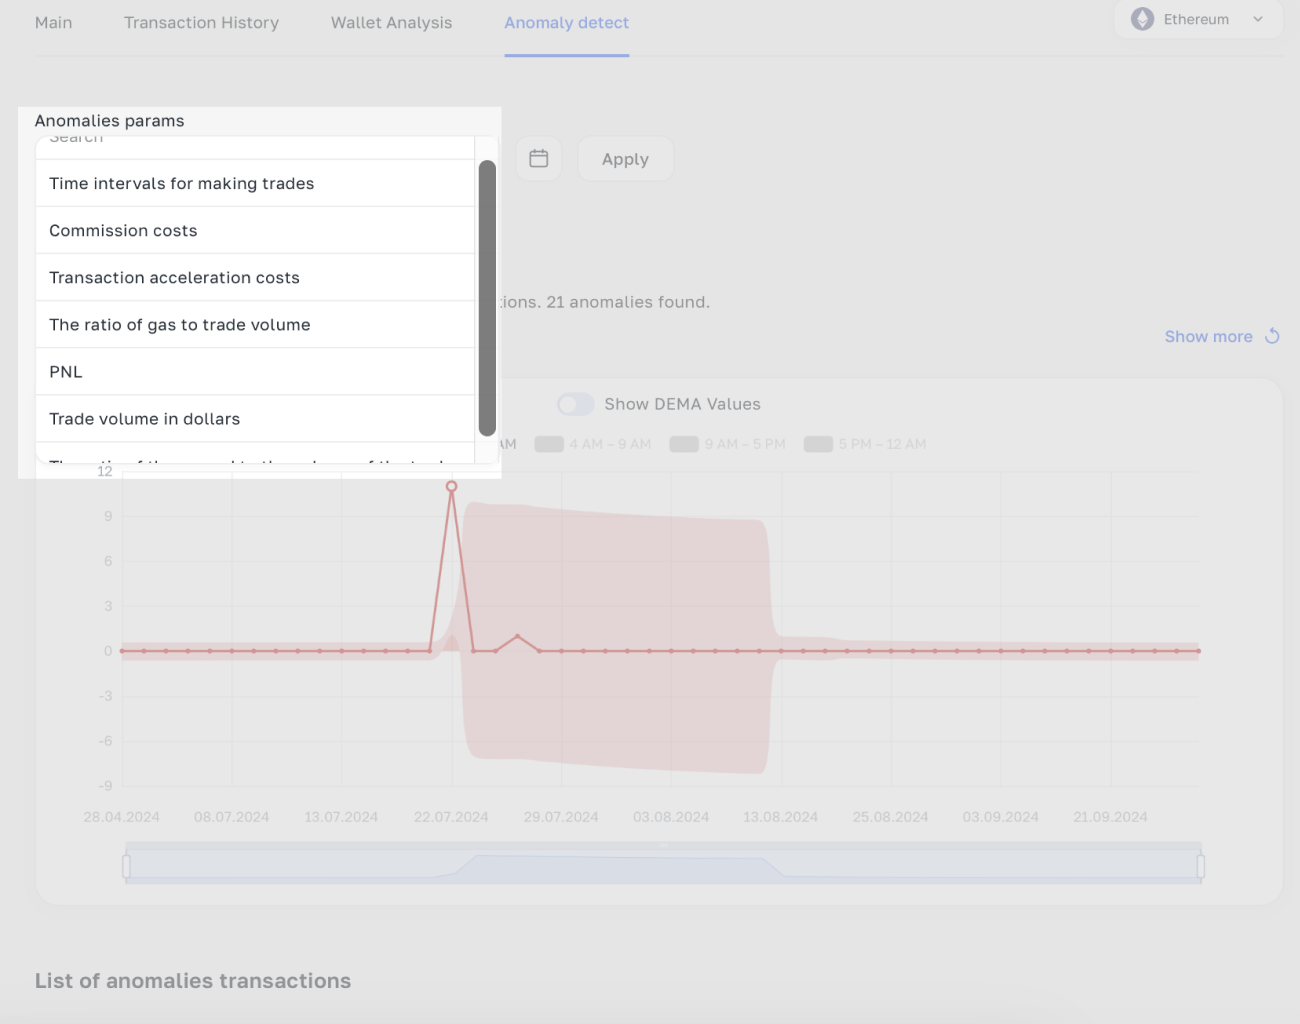
- Selecting an anomaly type
-
- If you click on this list, it will expand, allowing you to select any anomaly type of interest:
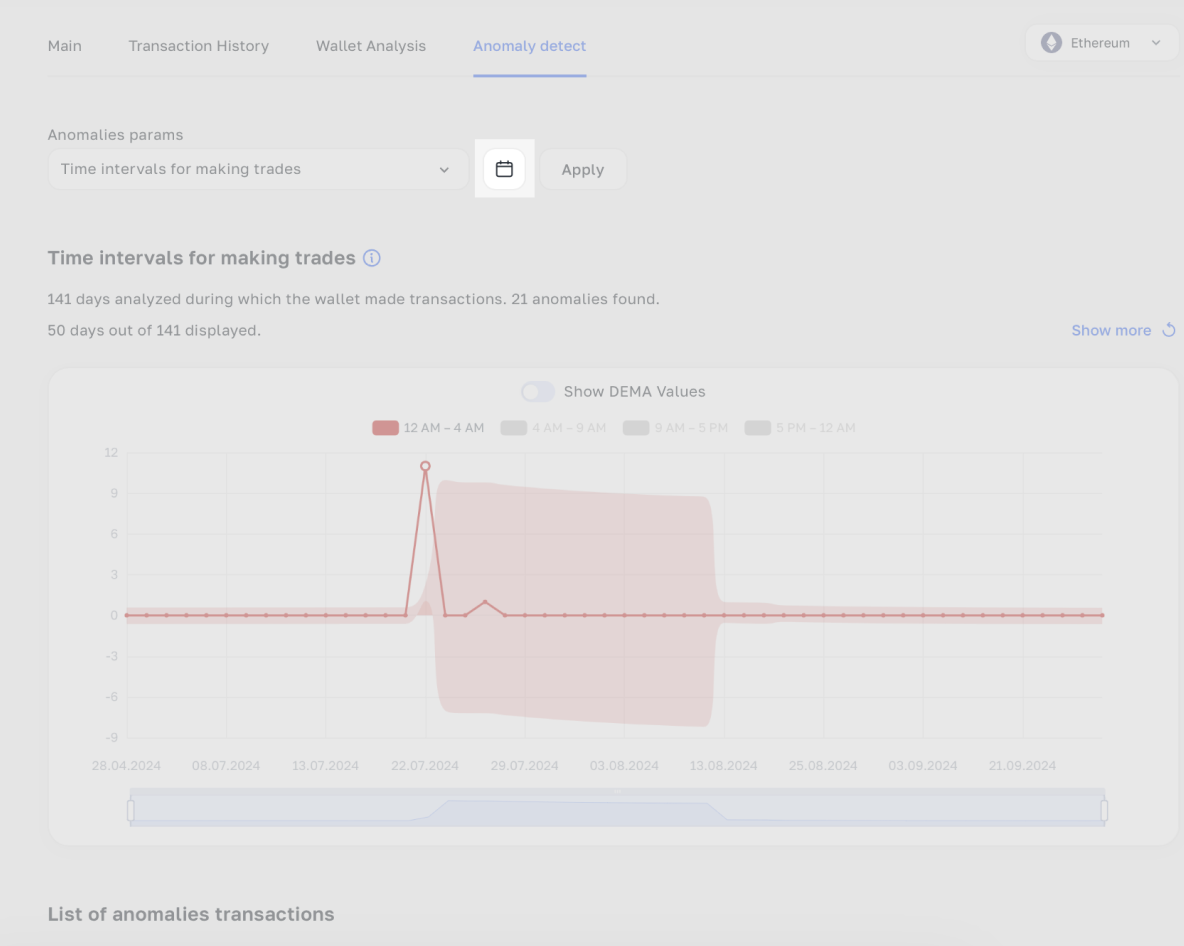
- Selecting a time range:
-
- Here you can select the time range within which the wallet performed trades, and during which you want to find anomalies.
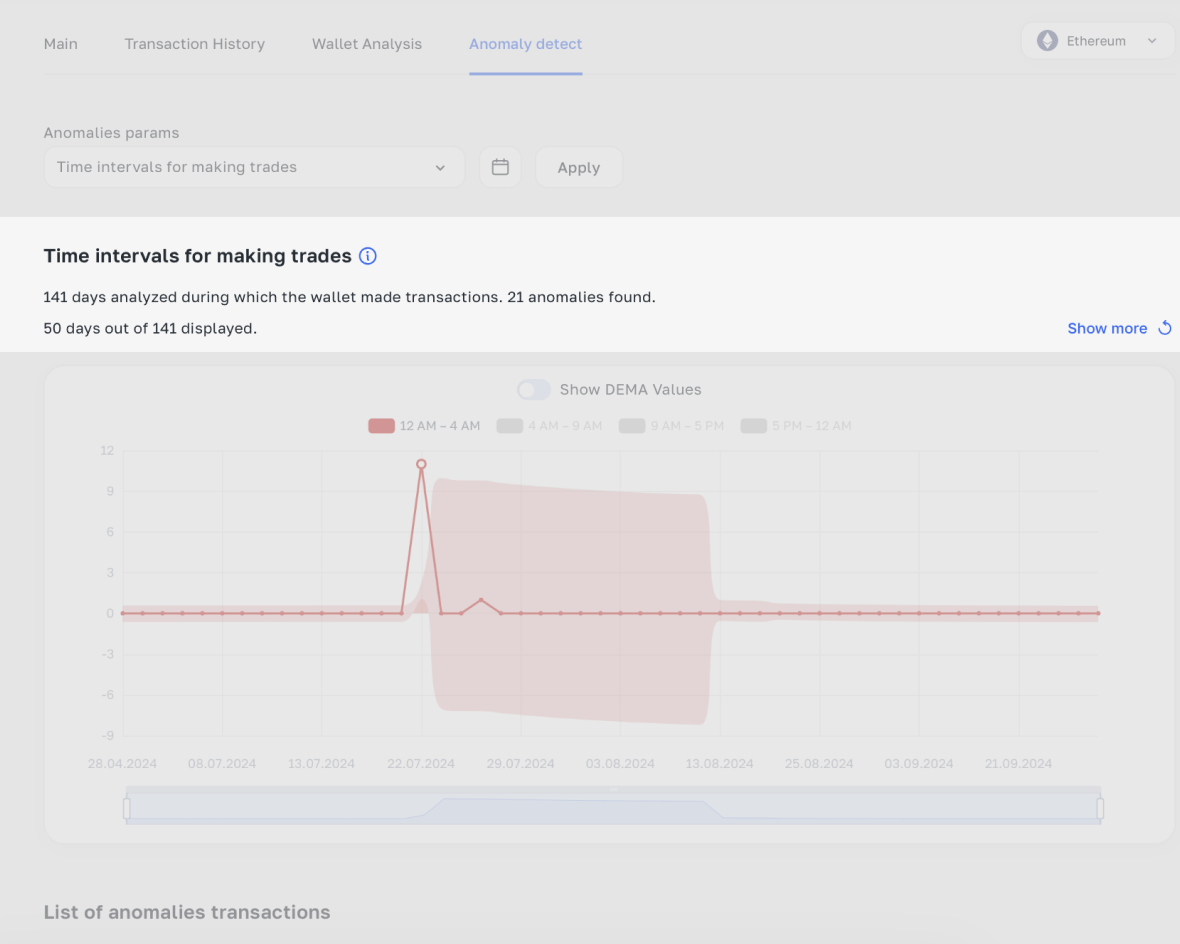
- Loading transactions
-
- If you hover over the blue icon next to the title (in this case, "Trade Time Intervals"), you will see an explanation of the anomaly type.
- If you click on the "Show more" button, you can load more data for the chart.
Chart
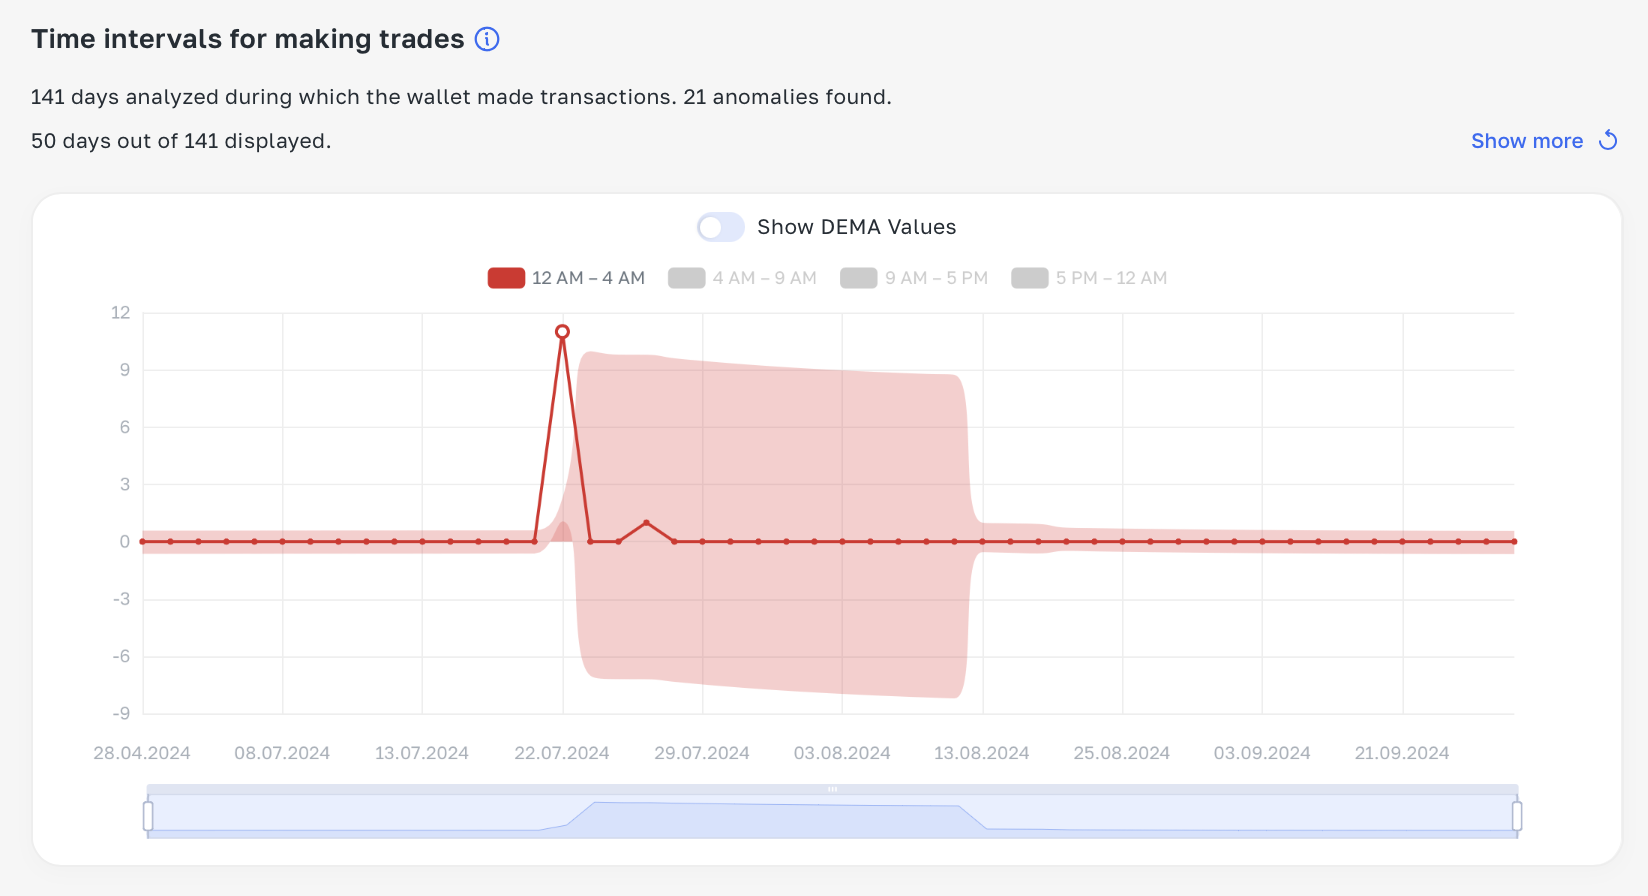
The most interesting part is the chart. Let's look at an example:
At the top of the chart, there is a "legend":
- First, we see the time intervals:
- 12 AM - 4 AM
- 4 AM - 9 AM
- 9 AM - 5 PM
- 5 PM - 12 AM
- Only one time interval, 12 AM - 4 AM, is "active" (displayed on the chart). To display another time interval, click on the gray square next to it:
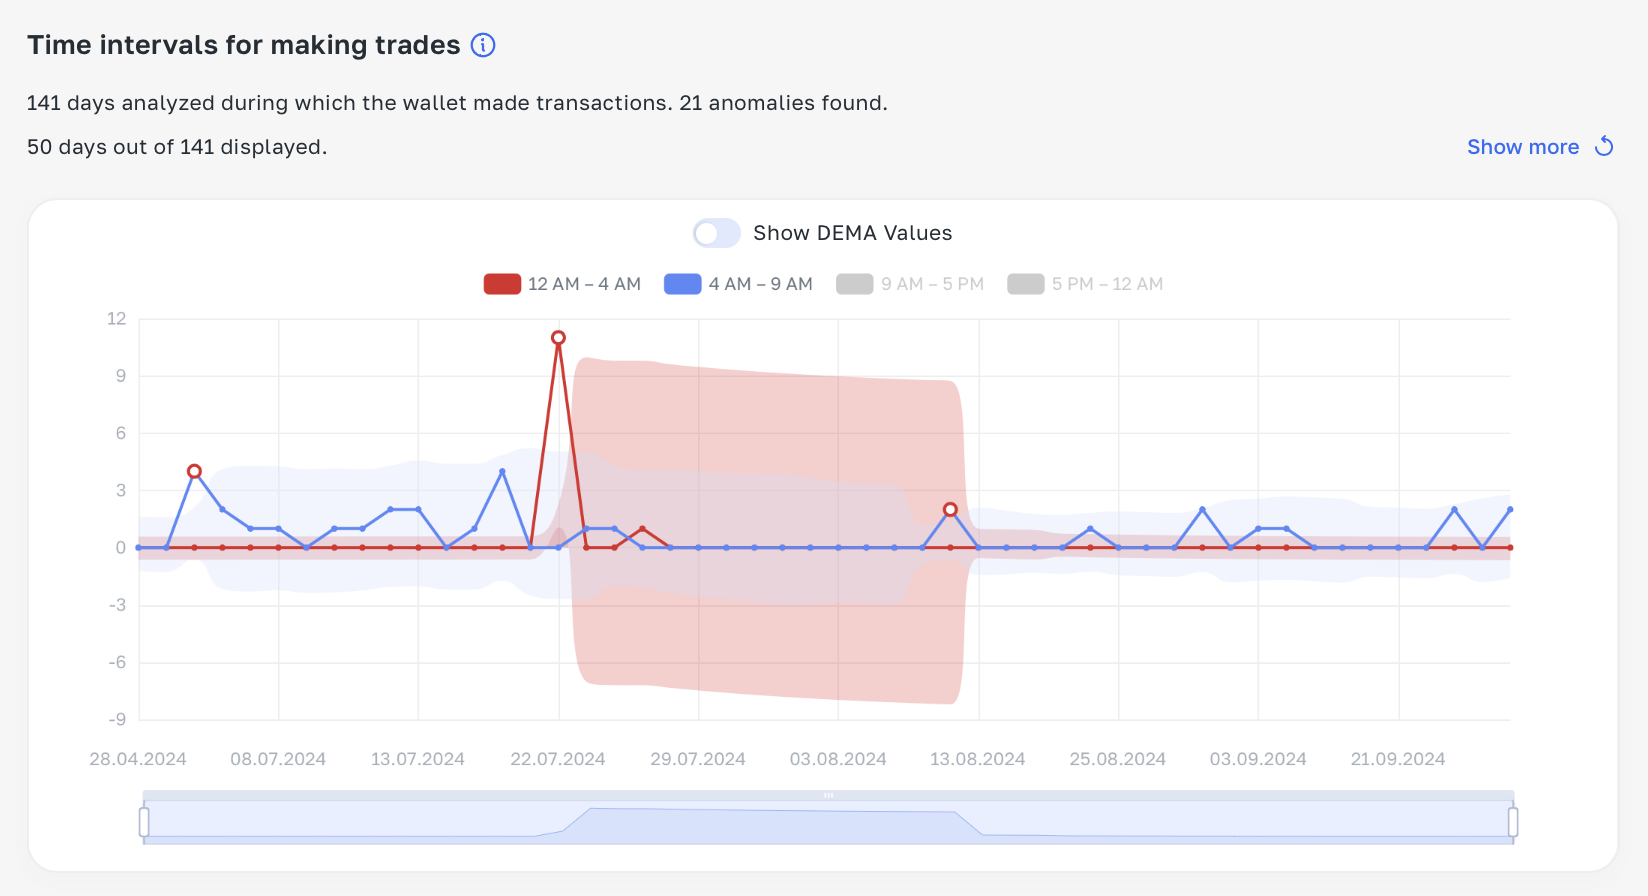
Great! Now we have two time intervals displayed:
- 12 AM - 4 AM
- 4 AM - 9 AM
Next, in the chart’s legend, there is a switch "Show DEMA values" – this button enables the display of a line around which the confidence interval is built.
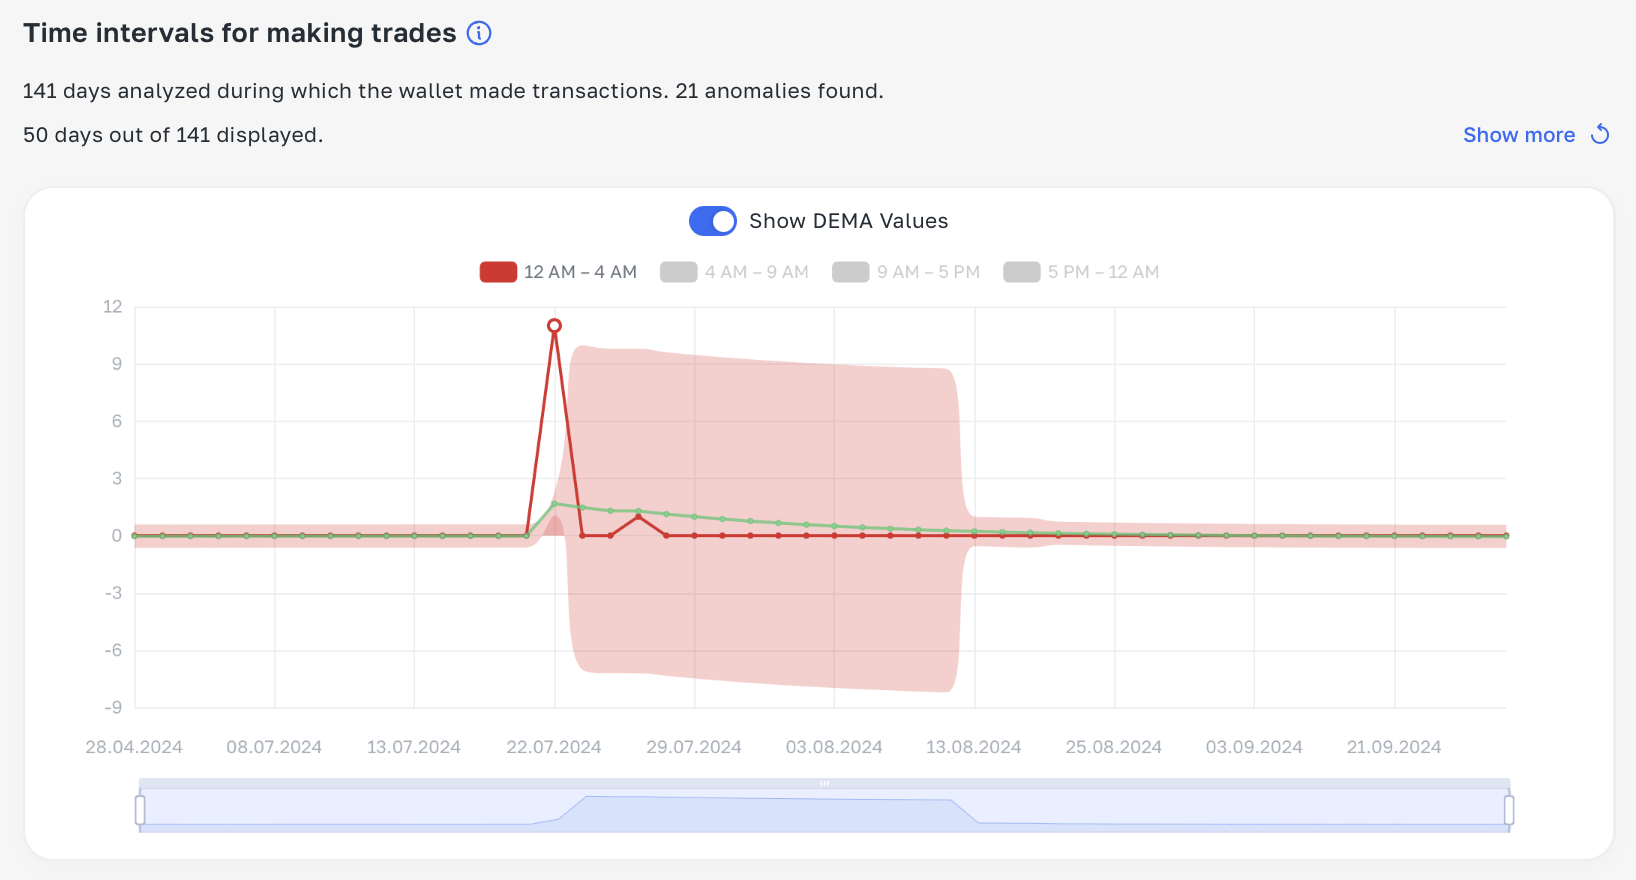
The confidence interval is a range within which the parameter is allowed to fluctuate. In the image above, the confidence interval is the pink area around the red line.
If a parameter (in this case, the number of trades executed within a specific time interval) goes beyond the confidence interval, it is considered an anomaly.
So, how can we find out which transactions were anomalous from this chart?
Anomalies are displayed as red dots on the chart – by clicking on one, the transaction list will scroll, and the anomaly will be highlighted in blue:

Now you have a convenient tool for simplified analysis of wallet trading history – nothing will escape your attention!
Want to learn more about crypto arbitrage?
Get a subscription and access the best tool on the market for arbitrage on Spot, Futures, CEX, and DEX exchanges.


