Maintaining Trader's Personal Statistics

with ArbitrageScanner!
Personal Statistics for Crypto Arbitrage Traders: How to Track Your Trades
Tracking your trades isn't bureaucracy — it's a growth tool. Without statistics you can't see which arbitrage spreads actually make money, which exchanges eat your profit through fees, and where you keep repeating the same mistakes. This guide shows you step by step how to use our trade tracker template by ArbitrageScanner.io.
📥 Get the template: open the spreadsheet in Google Sheets
What's inside:
• 📊 Dashboard — total annual profit + monthly chart
• 12 monthly sheets (January — December), 100 trades each
• Automatic calculation of spreads, PnL, ROI, and current balance
• Editable exchange list — supports any exchange
📌 Core rule: 1 trade = 2 rows
Each arbitrage trade (Long + Short) takes exactly two rows (visually highlighted with the same background color):
- Top row — the exchange where you go LONG.
- Bottom row — the exchange where you go SHORT.
⚡ Exception — Spot-Spot trades
If you're doing pure spot arbitrage (bought on one exchange → transferred → sold on another), the trade goes in a single row, the bottom row stays empty.
Spot-Spot example:
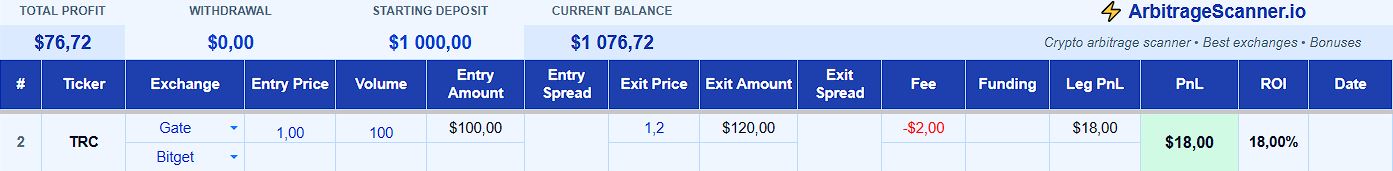
📝 Step-by-step trade entry
Step 1. Top section — capital block
Each monthly sheet has 4 fields at the top:
- Starting Deposit — how much money you had at the beginning of the month. Fill once.
- Withdrawal — how much you withdrew during the month. If nothing — leave 0.
- Total Profit — calculated automatically (sum of all trades for the month).
- Current Balance — calculated automatically: Starting + Profit − Withdrawal.

Step 2. Opening a trade
Ticker — coin name (e.g., TON, APTOS, BLUM). Type any.
Exchange — pick from the dropdown or type your own:
- Top row — long/spot exchange
- Bottom row — short exchange
- Exchanges marked
(f)mean the futures account of the same exchange
Entry Price — the average price at which you opened the position. Fill in for both exchanges.
📍 Where to find the entry price for futures:
- While the trade is open — Positions section, the Entry Price or Avg. Entry Price field
- After closing — Position History section, same average entry price
For spot — Order History, the order execution price.
Volume — number of coins bought/sold. Taken from the same position page on the exchange.
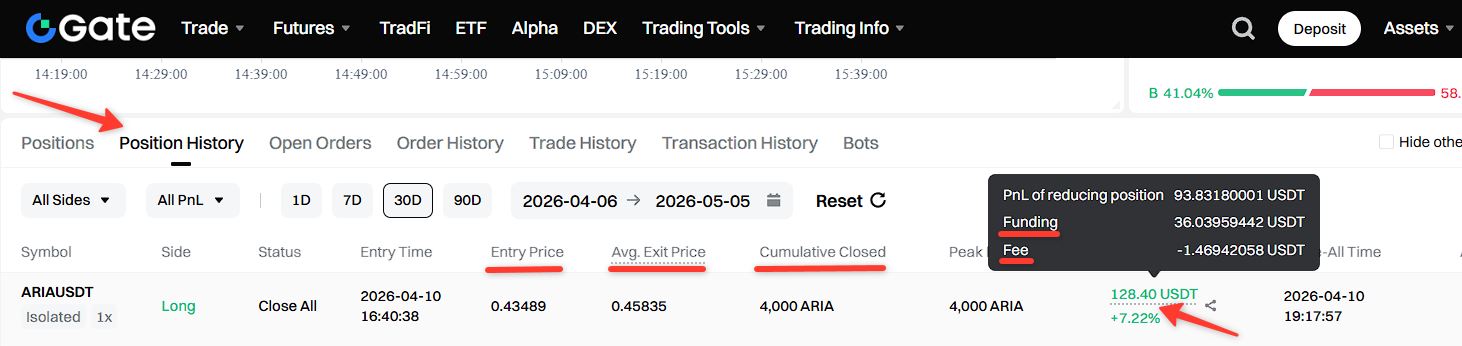
Example 1. Gate exchange
In the Position History section on Gate, all the data you need is in one row: average entry price, average exit price, volume, and total PnL.
Handy Gate feature (also works on Mexc, Bitget, OKX): hover over the PnL value and you'll see the full breakdown — opening fees, closing fees, and funding listed separately. This makes filling out the Fee and Funding columns a lot easier.
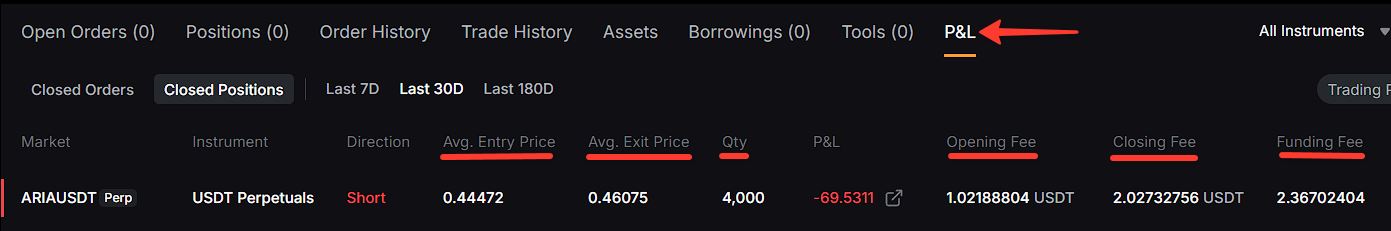
Example 2. Bybit exchange
On Bybit you'll find what you need in the P&L section — the entire history of closed positions sits in a single row each: average entry price, average exit price, volume, fees, and funding.
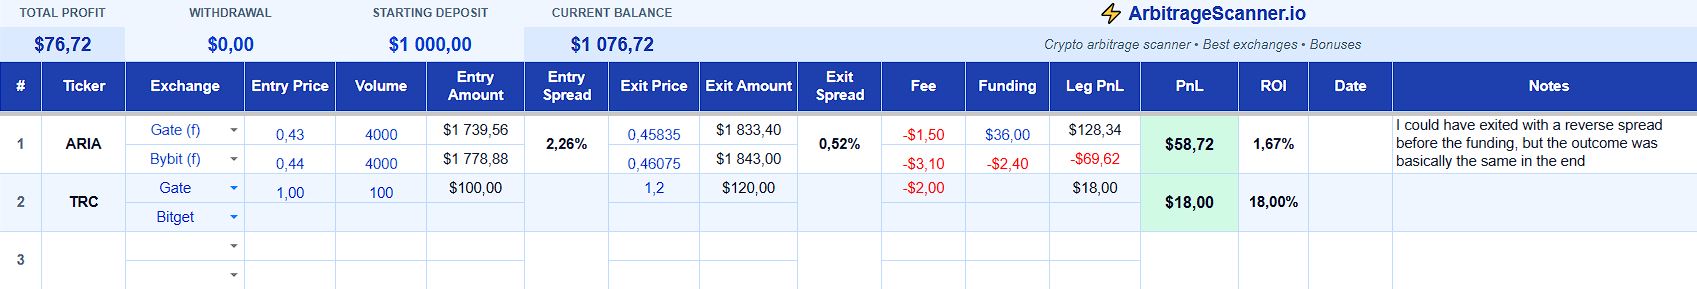
👀 What gets calculated automatically at this step:
- Entry Amount — how much money you put in (Entry Price × Volume)
- Entry Spread — the price difference between exchanges in %. Your main signal — how favorable your entry was.
Step 3. Closing the trade
Exit Price — the average price at which you closed the position on each exchange. Take it from the Position History (or P&L) — not from Order History, since there may be several partial closes there and we need the average.
Fee — total fee for the leg (open + close on a single exchange). Always with a minus sign: -2.5.
Funding — how much you earned or lost on funding over the entire holding period:
- Earned 50 USDT →
50 - Paid 50 USDT →
-50
Step 4. Done — the spreadsheet calculates everything
Once the exit prices are filled in, the spreadsheet will automatically calculate:
- Exit Amount — how much money you received on closing
- Exit Spread — price difference between exchanges at close
- Leg PnL — broken down per long and short exchange
- PnL — total trade result (green = profit, red = loss)
- ROI — return as % of total position size

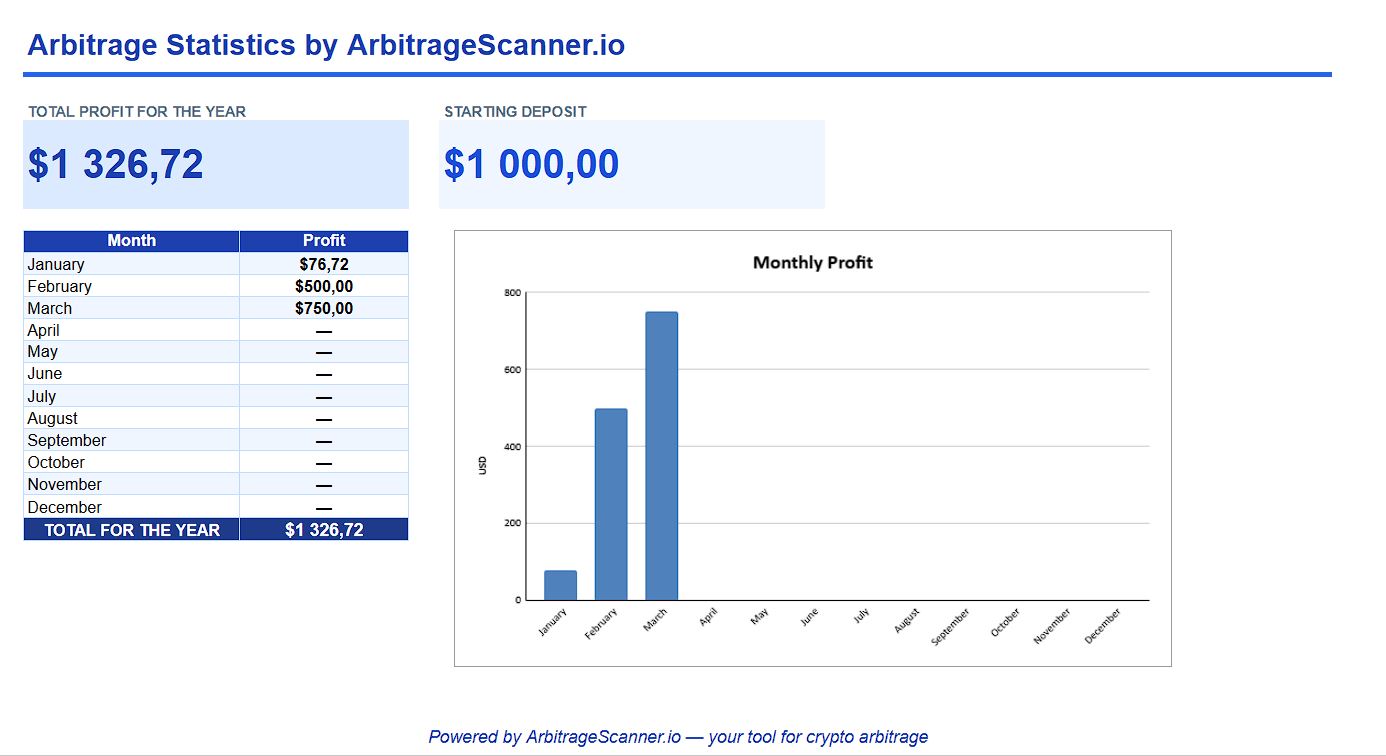
📊 Dashboard — yearly statistics
The first sheet is your annual dashboard:
- Total annual profit — large number on top
- Monthly profit breakdown — table + bar chart
- Yearly starting deposit — fill manually in the blue cell
All dashboard numbers update automatically as you add trades to the monthly sheets.
🛠 Useful tips
Adding or removing exchanges from the list
The exchange list uses standard "Data Validation" in Google Sheets / Excel:
- Google Sheets: click any cell in the Exchange column → menu Data → Data validation → edit list → Done
- Excel: tab Data → Data Validation → edit list values
You can also just type any exchange directly into a cell — it will be accepted without errors.
Hiding columns you don't need
Any column you don't use can be hidden without breaking formulas. Right-click the column letter → Hide.
Example: if you only do Spot-Spot arbitrage, you can hide the Funding column — there's no funding on spot. Same goes for any other column you find unnecessary.
Formula protection
Cells with formulas are protected from accidental deletion. Once you make your own copy of the spreadsheet in Google Sheets, the protection is removed automatically.
💡 Tips for keeping good statistics
- Fill at least partially right away. If you're really pressed for time — log the bare minimum: ticker and exchanges. Prices, fees, and funding can be added later when you have a free moment. The main thing is not to forget the trade existed.
- Use the Notes field. Write down everything important — why you took the spread, what went well, what went wrong, any technical issues. A month later these notes are gold both for fixing mistakes and for repeating successful setups.
- Review once a month. Open the Dashboard, look at the chart. Find both your best trades (understand what worked → repeat) and your worst (understand which exchanges or pairs eat the most profit).
- Don't edit formulas. Fill only the blue fields — they're for manual input. Black values are automatic calculations.
Crypto arbitrage trade tracker template by ArbitrageScanner.io — copy here.
Good spreads and steady profits! 🚀
Want to learn more about crypto arbitrage?
Get a subscription and access the best tool on the market for arbitrage on Spot, Futures, CEX, and DEX exchanges.

