The table that shows spreads — what do the columns mean?
with ArbitrageScanner!
Futures Scanner Spreads Table
The second block of the futures scanner interface is the table.
It includes the following columns:
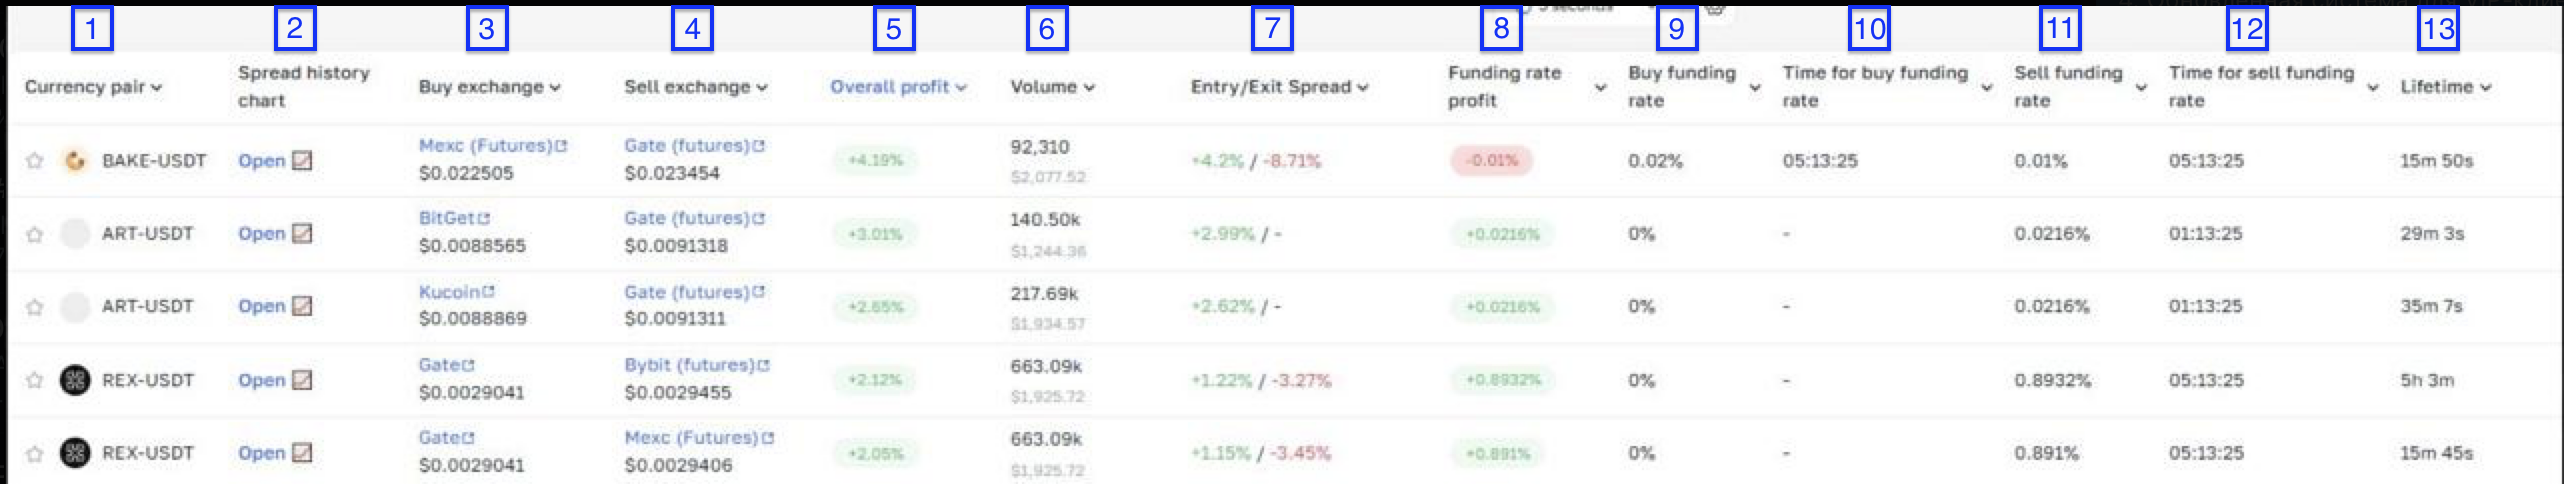
[1] Trading Pair
Shows the asset for which a spread was found.
[3] Spread History Chart
A chart that shows the history of spread convergence and divergence between exchanges, helping you understand its maximum and minimum values for more precise arbitrage decisions.
[3] Buy Exchange
Shows the exchange used for buying, a direct link to the platform, and the purchase price of the asset. If the purchase is made on futures, there will be a corresponding note in parentheses.
[4] Sell Exchange
Displays the exchange where you can sell the asset, a link to the platform, and the selling price. If the sale is made on futures, there will also be a corresponding note in parentheses.
[5] Total Profit
Total profit from the trade, based on the price difference and funding.
[6] Volume
The amount in tokens and dollars that you can execute the trade with.
[7] Entry/Exit Spread
Entry spread — the profit percentage from the price difference.
Exit spread — the profit percentage if calculated for the “reverse” spread.
A dash means it’s impossible to calculate the reverse spread for the specified trade volume (i.e., there isn’t enough volume either in the ask orders on the selling exchange or in the bid orders on the buying exchange).
When calculating both values, the funding rate is not taken into account.
P.S. In simple terms, the entry spread is the spread you can enter at right now for the specified volume, and the exit spread is the spread you can exit at right now for that same volume.
[8] Profit from Funding Rate
The percentage of profit or loss from the funding rate.
[9] Funding Rate for Buying
The rate you will pay or receive on the exchange where you buy.
[10] Time Until Funding Rate (Buy)
Shows how much time is left until the next funding rate payment on the exchange where the futures contract was bought.
[11] Funding Rate for Selling
The rate you will pay or receive on the exchange where you sell.
[12] Time Until Funding Rate (Sell)
Shows how much time is left until the next funding rate payment on the exchange used for selling futures.
[13] Lifetime
This is the time that shows how long the arbitrage pair has existed. The longer the lifetime, the less attractive the trade and the higher the risk.
You can sort table parameters in descending or ascending order. For example, if you want to see trading pairs with the highest total profit, click the arrow icon next to the column name:

You can also choose the table refresh rate:

From 5 to 15 seconds, or disable it to first explore the workspace:

RECOMMENDATION: time is your main ally — the more often your pairs refresh, the faster you can react to a profitable spread, and therefore the higher your earnings. Use a 5-second refresh rate after you have thoroughly familiarized yourself with the workspace.
Next to the refresh function there is a gear icon that allows you to customize the spreads table:

You can arrange columns in the way that is most convenient for you by changing their order. In addition, you can hide any columns you consider unnecessary by clicking the eye icon:

Futures Scanner Capabilities and Advantages
We strive to be market leaders, so we keep improving and are ready to share the capabilities and advantages of our product.
That is why we offer a set of key capabilities and advantages of our product, including:
-
A wide selection of exchanges
The futures scanner supports many exchanges for: spot trading (CEX), perpetual futures (CEX), DEX, and DEX futures. This makes it possible to find arbitrage opportunities across different platforms, expanding your arbitrage possibilities.
-
Monitoring spot and futures prices
Our product tracks price differences for the same assets across futures and spot markets. This provides opportunities to profit from price discrepancies using various strategies.
-
Funding rates display
The scanner provides funding rate data — percentage payments every 4 or 8 hours. This approach allows you to use funding rate arbitrage as an additional earning mechanism.
-
Flexible search filters
A wide list of filters allows you to set parameters for finding the most profitable arbitrage situations, saving you time and increasing the efficiency of the service.
-
Customizable workspace
A customizable workspace allows you to adapt the display of arbitrage opportunities to your individual needs, ensuring convenience and efficiency in finding profitable trades.
-
High throughput
The scanner can process up to several thousand arbitrage situations simultaneously. This means you will be among the first to learn about an arbitrage opportunity that can help you earn.
-
Sharing strategies and experience
Our service is not just a set of earning tools, but also a useful and up-to-date knowledge base aimed at sharing the best practices and expertise with our users. By helping you improve your trading approaches, we confirm our status as a market leader.
-
Spread history chart
This tab helps you understand when it makes sense to enter a spread and when it doesn’t. Also, thanks to it, you can work more precisely with funding — seeing when it is more profitable to enter and exit.
Want to learn more about crypto arbitrage?
Get a subscription and access the best tool on the market for arbitrage on Spot, Futures, CEX, and DEX exchanges.

