Understanding Exchange Interface and Key Elements for Futures Arbitrage Trading

with ArbitrageScanner!
Futures arbitrage requires a good understanding of how to work with exchanges and futures. Effective trading requires knowing how to navigate the interface and use the key tools of the exchange.
Let's look at the main elements you will need for successful futures arbitrage using the example of the Bybit exchange interface.
4.1 SPOT AND FUTURES TRADING SECTIONS
4.1.1 SPOT TRADING SECTION
To go to the spot trading section, simply hover your cursor over the "Trade" tab and select "Spot Trading":

Spot trading – a type of trading where assets are bought and sold immediately at the current rate.
4.1.2 FUTURES TRADING SECTION
To access the futures trading section, click on the "Derivatives" button and select "USDT Perpetual Futures":

Futures trading – a type of trading based on the idea of predicting the price movement of an asset in one direction or another.
4.2 COIN SEARCH BOX
To find the desired trading pair where arbitrage has occurred, you need to use the search box by hovering your cursor over the corresponding icon and entering the altcoin ticker:

NOTE: Make sure you are in the correct futures section where the spread occurred. In most cases, we will work with perpetual futures contracts (Perpetual) and less frequently with pre-market.
4.3 FUNDING YOUR FUTURES ACCOUNT
If you are working with a futures account for the first time, you will need to fund it.
To do this, in the account section, select derivatives from the drop-down list of assets:

Once there, you just need to click on transfer and select:
-
Transfer from spot account to derivatives account;
-
Specify the amount you want to transfer
-
And click confirm:

After completing the above actions, the futures account balance will be replenished by the specified amount.
4.4 TRADING PAIR AND ITS PRICE
4.4.1 TRADING PAIR
Trading pair – a combination of two currencies that can be exchanged with each other.
For example, the LINK/USDT pair means that we have chosen to trade LINK for USDT:

Each trading pair consists of two parts:
-
Base currency (LINK) – the currency you plan to trade. In our case, this is LINK.
-
Quote currency (USDT) – the currency in which the base currency is purchased. In this case, it is USDT.
4.4.2 TRADING PAIR PRICE
Trading pair price shows how much of the quote currency is needed to pay for one unit of the base currency.
In our example, the LINK/USDT price is $10.87:

That is, for one unit of LINK, we will pay 10.87 USDT.
4.5 INDEX PRICE
Index price – the average spot price of an asset on various exchanges, used to adjust the cost of futures.
As follows from the definition above, the index price is mainly used on derivatives markets such as futures, where it is important to consider the average price of the asset on several exchanges to ensure more stable and transparent trading conditions:

On the spot market, the price is determined directly by supply and demand at the time of the transaction, so the index price is not relevant here.
4.6 24-HOUR TRADING STATISTICS
This block provides information about trading activity over the past 24 hours:

It includes:
-
24-hour change in absolute value and percentage. In our example, LINK lost $0.495 in value or decreased by -4.43%
-
24-hour high in absolute value. That is, LINK rose to $11.191 over the past day
-
24-hour low in absolute value. In other words, LINK dropped to $10.658 over the past 24 hours
-
24-hour volume in absolute value, indicating how much was bought and sold over the day. When hovering over it, it can be measured both in USDT and in LINK:

4.7 OPEN INTEREST
Open interest (sum of open positions) – the number of open futures contract positions on a specific token.
This indicator is used only on futures markets:

In our example, the sum of open positions in LINK futures contracts is 4,978,974 units.
Purpose of open interest:
-
Market activity: High open interest indicates that many traders are participating in the trade, which may indicate good liquidity.
-
Trader sentiment: If open interest is rising, it may indicate that traders are opening new positions, which can affect the price. If it falls, it means positions are being closed.
-
Arbitrage opportunities: A sharp change in open interest can create increased volatility, and thus arbitrage opportunities.
4.8 FUNDING RATE
As we discussed earlier, an additional element of earning in futures arbitrage is the accrual of the funding rate.
Funding, funding rate – these are percentage payments between futures market participants, which usually occur every 8 hours.
You can view it in the futures trading section:

NOTE: During periods of high volatility, exchanges may adjust the funding rate limit. This means that the funding accrual may be, for example, not every 8 hours, but every 6 hours. This is done to stimulate the futures contract price to return to acceptable price ranges.
One of the main functions of the funding rate is to keep the futures contract price close to the spot price of the asset.
Remember the following:
-
Positive rate: Long traders (long positions) pay short traders (short positions)
-
Negative rate: Conversely, short traders (short positions) pay long traders (long positions).
For example, when opening a short position on LINK with a positive rate (+0.01%), we will receive a payment from long traders for our price decline forecast. And this accrual will occur after 2 hours 32 minutes and 56 seconds (Figure 16)
On the other hand, if we open a long position on CHZ with a negative rate (-0.5141%), we will pay long traders for our price increase forecast. Moreover, it will be deducted from us after 1 hour 47 minutes and 25 seconds:

Each exchange has information about updating the funding rate limits. For example, on the Bybit exchange, they are located here:

The funding rate, as an important marker of market sentiment, can give us a clue.
Thus, a positive rate indicates a bullish sentiment: most traders expect the price to rise, holding long positions.
A negative rate signals a bearish sentiment: short positions predominate, indicating that traders expect the price to fall.
For you, we have compiled a convenient and informative table of funding rates in our service – Funding Rates:

Where you can view in real-time the sentiment (mood) on coins, based on the funding rate.
In addition to the ease of reading and customizing views by exchanges, this product can be used when trading by the funding rate arbitrage strategy.
4.9 CHART AND ITS ELEMENTS
4.9.1 EXCHANGE ASSET CHART
One of the key tools for trading is the chart.
Chart – a visual representation of the price movement of the selected asset over a certain period.

4.9.2 TYPES OF CHARTS
Let's break down the types of charts and their features that you can choose here:

-
Standard. This is the basic chart with essential functions for price analysis. It is suitable for those who want to quickly see the overall picture of the asset's price change. It cannot be customized, but due to its simplicity and convenience, it is ideal for beginners:

-
TradingView. An advanced version of the chart that includes many tools:

It allows you to customize (change background, change bar colors, etc.), set up indicators, draw trend lines, and other elements. This chart is suitable for both beginners and experienced traders who use technical analysis tools when reading the chart.
-
Depth Chart. Shows the ratio of buy and sell orders, visualizing demand and supply in the market as two opposing lines:

This chart has two curves:
-
Green curve (left chart) – shows buy orders. The higher the volume of buy orders at a certain price, the higher this curve
-
Red curve (right chart) – shows sell orders. The more sellers at a certain level, the higher this line.
The intersection of these two curves indicates the current market price of the asset.
This type of chart is used for:
-
Understanding liquidity. The depth chart shows how easy or difficult it will be to buy or sell the asset without significantly changing its price.
-
Assessing the balance of supply and demand. You can see where more buyers or sellers are concentrated. If the green curve is significantly higher, this may indicate increased demand.
4.9.3 CHART ELEMENTS
The chart contains important elements that help analyze price movements on assets. Understanding these elements allows you to read the chart faster. They include:
-
Timeframes:

This is the time interval that we consider on the chart. For example, you can look at price changes over 1 minute or 1 day. Choosing a timeframe helps you understand how the price behaves in the short or long term.
-
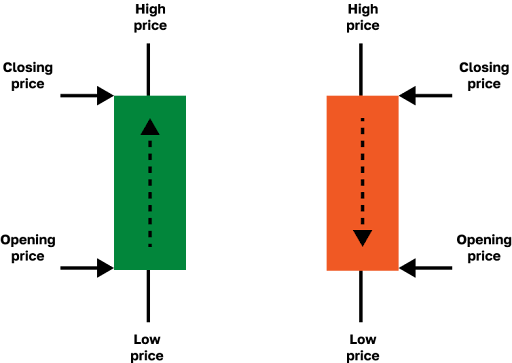
Bars or Japanese candlesticks

This is the main way to display prices. Each candlestick shows:
-
Maximum price;
-
Closing price;
-
Opening price;
-
Minimum price.
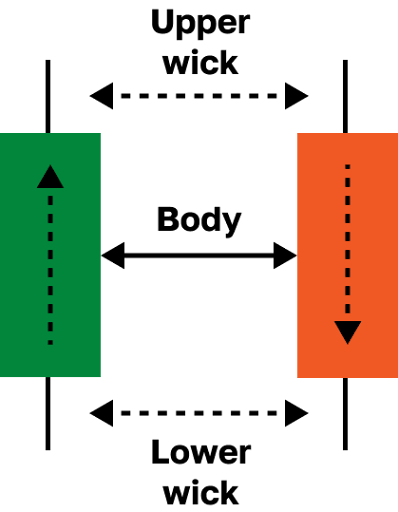
Each candlestick has the following elements:
-
Shadow (wick) – the highest and lowest points reached by the price;
-
Body – the space between the opening and closing of the candlestick.
If the body of the candlestick is red, then the closing price is lower than the opening price. If the body is green, then the closing price is higher than the opening price.
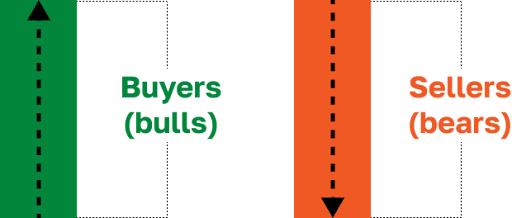
To understand Japanese candlesticks, and thus read the chart, you need to keep three factors in mind:
-
Candlestick color will tell you who controls the situation: buyers (bulls) or sellers (bears):
-
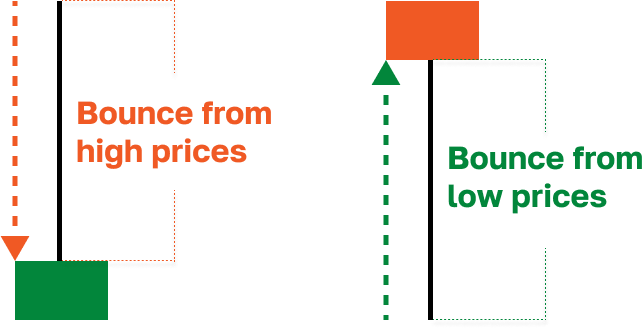
Shadow length will show the price rebound from a certain level:
-
Body size will show the strength of buyers or sellers:


By combining these three factors, we can read the chart well.
-
Indicators
These are special tools added to the chart to better understand what is happening in the market:

For example, moving averages (MA) show how the price changes over time, and the relative strength index (RSI) helps determine if the asset is overbought or oversold.
-
Trading Volume
This is the amount of the asset that was bought and sold over a certain period:

High volume may indicate that there is significant interest in the asset, which can affect the price.
-
Chart Display Style
You can choose between different chart display styles:

You can select the display from the drop-down list: bars, candlesticks, line chart, area, etc.
Switching to a line or area chart, which is a variation of the line chart, will allow you to assess the overall trend (direction) of the asset. Although it makes such data visually obvious, it is not suitable for displaying details on lower timeframes.
On the other hand, the candlestick chart, or Japanese candlesticks, is considered the most informative. It allows you to evaluate the closing price, opening price, maximum, and minimum for the selected interval. Such visualization provides a detailed picture of market movements and helps you navigate better.

RECOMMENDATION: In futures arbitrage, use candlestick charts due to their informativeness.
-
Cursor and Crosshair
These tools help you see the exact price and time values on the chart:

By hovering the cursor over a specific bar, you will see the price and date at which the asset was traded.
-
Chart Zoom and Scroll
These elements allow you to zoom in/out on the chart and view the asset's behavior over history.
If you are working on a computer, then:
-
You can change the zoom using the mouse wheel or touchpad: scrolling up will zoom in, and scrolling down will zoom out.
-
You can move the chart by holding down the left mouse button or touchpad and moving it in the desired direction.
If you are working on a smartphone:
-
To change the zoom, spread two fingers apart on the screen to zoom in or pinch them together to zoom out.
-
To scroll the chart, swipe your finger left or right.
-
Chart Customization
You can customize the chart to your liking: change the background color, add indicators, and other parameters from the tool panel (trend lines, labels, text, etc.):

Below is an example of customization and adding a volume indicator to the chart:

Such customization features can make your work more comfortable.
NOTE: These customization settings are usually available when using the TradingView chart type.
-
Key Price Indicators for the Timeframe
These values help quickly assess how the asset behaved over the selected timeframe:

They include:
-
O (Open) – the opening price for the timeframe. In our example, the opening price for LINK over 1 hour is $10.531
-
H (High) – the maximum price for the timeframe. In our example, the maximum price for the timeframe (1 hour) for LINK is $10.531
-
L (Low) – the minimum price for the timeframe. In our example, the minimum price for the timeframe (1 hour) is $10.491
-
C (Close) – the closing price for the timeframe. In our example, the closing price for the timeframe (1 hour) is $10.503
-
Absolute and relative change in price for the timeframe. In our example, LINK decreased by $0.028 or -0.27% over the timeframe (1 hour)
These values will help you quickly assess how the asset behaved over the selected interval.
-
Time and Price Axes
On any chart, you always see two axes:

-
Time axis is located at the bottom of the chart and shows time marks – these are dates and times. It helps track how the asset's price changed at different times, which is important for trend analysis.
-
Price axis is on the right and displays price levels. This axis shows the prices at which the asset was traded at certain times. The current price is usually highlighted or located at the top of this axis to make it easier to find.
4.10 ORDER BOOK
The order book window displays information about current buy and sell offers for assets in real-time:

Main elements:
-
Price – here are the buy and sell offers in USDT. The upper part shows the prices at which traders want to sell, and the lower part shows the prices at which they want to buy.
-
Qty (Quantity) – the amount of the asset (e.g., LINK) available for trading at each price.
-
Total – the total amount of the asset available for buying and selling at each price level (This mode can be toggled between token and USDT).
-
Red lines (top) – sell offers. The more filled the red line, the higher the volume of the offer at that price.
-
Green lines (bottom) – buy offers. The more filled the green line, the higher the volume of bids at that price.
-
Current Price – located between the buy and sell offers. In this case, it is 10.567 USDT. Next to it is the Mark Price, which reflects the fair market price based on the spot prices of major exchanges.
-
Buyer and Seller Balance – at the bottom, there are indicators showing the percentage ratio between the volume of buy orders (B - green) and sell orders (S - red). This is the supply and demand ratio for the top 20 levels in the LINKUSDT order book. In the example, 53% are buyers, and 47% are sellers.
Note the settings panel located above the order book:

Here we can switch to the panel display mode. It will be useful to look at the BID (buy offers) and ASK (sell offers) panels.
4.10.1 BID PANEL: WHAT IS IT
The BID panel displays the current buy offers for the asset at different prices:

Here, buyers indicate the maximum prices at which they are willing to purchase the asset and the corresponding volume.
The BID panel is important for understanding the current demand for the asset. Higher volumes and dense lines, as in Figure 44 (level $11.077), indicate that a large number of buyers are concentrated at these points.
For your convenience, you can switch the display of the Total column from LINK to USDT:

Thus, the higher the green lines, the greater the volume of buy offers. This is important for assessing demand and seeing how much liquidity can be used to sell the asset.
4.10.2 ASK PANEL: WHAT IS IT
The ASK panel shows the current sell offers for the asset. Here, sellers indicate the minimum prices at which they are willing to sell the asset and the volumes they want to sell:

The ASK panel helps assess the supply of the asset in the market. Large sales volumes at certain price levels may indicate high seller interest.
The more volume and fill of the red lines at the top levels, the more liquidity on the seller side. This allows traders to better assess the potential for price movement downward and make trading decisions.
This panel can also be switched to display the Total column from LINK to USDT:

Thus, the red lines display sales volumes: the longer they are, the more sellers there are in the market. This allows you to assess liquidity and understand how easy it is to buy the asset.
4.10.3 HOW BID AND ASK PANELS HELP IN WORK
Summarizing how the order book display modes from the BID and ASK panels help us:
-
Assess current market sentiment, showing at which price points more buyers and sellers are concentrated.
-
Understand the liquidity of the asset: large volumes in BID and ASK mean that the asset can be bought or sold without significant changes in its price. This is especially useful when working with large capitals on low-liquidity instruments.
-
Determine market maker activity zones: large liquidity columns may signal where market makers have concentrated their orders to hold or change the price by buying or selling the asset.
In practice, using the BID and ASK panels allows for a flexible approach to order execution, i.e.:
-
To buy the asset, you can place a limit order at the price in the BID panel, which means the order will be waiting until a seller willing to execute it at the specified price appears. This approach is useful if you are not aiming for instant execution and want to acquire the asset at a price favorable to you.
-
If instant execution is important, the purchase can be made at the price in the ASK panel, where the sell offers are located. In this case, the order is executed instantly, as you agree to the current price of the sellers.
For example, the offer at a certain price is 1000 coins, and you want to buy 2000 at the same price. When placing an order, you will buy the available 1000 coins, and the remaining 1000 will remain active in the order book and will be executed as new offers appear. Thus, part of the order is executed immediately, and the rest waits until the market offers the necessary volume.
4.11 MARGIN TRADING MODES
Margin trading allows traders to open positions with amounts exceeding their own funds by using borrowed funds.
Margin — is the amount a trader uses as collateral for open positions. In simple terms, margin = collateral amount.

It shows how much risk a trader is willing to take in case of unfavorable market movements. Different margin trading modes allow managing this risk differently. Below we will consider two main modes.
4.11.1 ISOLATED MARGIN
In isolated margin mode, the collateral amount deposited for a specific position is isolated from the trader's overall account balance.
This means that if the market moves against you, the losses will only be within the allocated amount for that specific position.
RECOMMENDATION: This is the margin trading mode we will use in futures arbitrage, as it allows controlling risks and limiting potential losses.
4.11.2 CROSS MARGIN (CROSSED MARGIN)
Cross margin uses your entire available futures account balance to maintain positions and prevent their liquidation.
In other words, if the market moves against you, all your funds will be used to cover losses.
NOTE:
1. We do not use this type of margin trading in futures arbitrage. Despite allowing to avoid liquidation at the expense of all available funds, it also significantly increases the risk of losing the entire balance.
2. When you start arbitraging futures, do not forget to switch to isolated mode. Exchanges have cross margin set by default. Please be vigilant.
4.12 LEVERAGE
Leverage – is a loan that the exchange provides to the trader to open a trade with an amount exceeding their own capital.

In simpler terms, the exchange provides you with a tool that can increase the size of your position.
Example 1:
Opening a position of 1500 LINK at a price of $10 with 1x leverage, we will use an initial margin of $1500.
If we decide to take 3x leverage, the amount we can trade will increase to $4500 with the same required margin of $1500.
Example 2:
Opening a position of 750 LINK with 3x leverage, the trader uses a margin of $1500, but part of their own funds remains in reserve. This limits risks in potential losses.
You can set the leverage manually or by moving the slider:

NOTE: We do not recommend working with high leverage. In futures arbitrage, we will use 1x leverage to minimize potential risks.
4.12.1 FEATURES OF WORKING WITH HIGH LEVERAGE
The higher the leverage, the less margin you need to deposit to open a position. This allows you to open larger positions with a smaller amount.
However, with increasing leverage, your liquidation price gets closer to the entry price, meaning that with unfavorable market movements, your position may be quickly liquidated:

4.12.2 FEATURES OF WORKING WITH LOW LEVERAGE
With low leverage, more margin is used, making positions more stable.
Liquidation occurs with significant price movements, as the position has more room for losses. However, traders cannot increase their profit, as the position size is limited:

NOTE: Be sure to set the leverage before entering a trade, as many exchanges have a default setting of 10x!
4.13 ORDERS: THEIR FEATURES AND TYPES
Order (request) – is a command you give to the exchange to buy or sell an asset.

When creating an order, we specify what we want to do: buy or sell and at what price and quantity.
4.13.1 ORDER VOLUME SETTING
The order volume can be set by the amount of the asset and by cost:

Choosing by asset volume, we specify how many units (in our example, LINK) of the token we are buying or selling. For entering the quantity of the token volume, use manual input or by moving the slider:

This type of order volume setting is useful when you focus on the amount of the asset and it is important for you to enter the trade exactly at this token quantity.
Choosing order volume by cost, we specify the amount for which we open the position. Here you can also use manual input or the slider:

This type of order volume setting is useful if you are working within a strictly limited budget and want to use part of the available funds with maximum efficiency.
Depending on your approach and strategy, you can choose one of these methods.
In trading, it is important to understand the types of orders. Below we will consider the main types.
4.13.2 LIMIT ORDER
This is a request to buy or sell an asset at a specified price or better. This type of order is used if you want to buy an asset cheaper than the current market price or sell it more expensively.

Limit orders add liquidity to the market because they fall into the order book, or order book, and wait for execution.
If you use a limit order, you become a market maker, because you "create" the market by adding liquidity.
4.13.3 MARKET (MARKET) ORDER
This is a request for an immediate purchase or sale at the best available price from the order book.

This type of order is used when execution speed is important, not a specific price. The execution price may be better or worse than expected, depending on market movements.
When using a market order, you become a taker, because you "take" liquidity by executing existing requests.
4.13.4 CONDITIONAL ORDER
A type of order that is activated when the price reaches a specified level (trigger zone):

This type of order is useful for automating trading: it can be used when trading on level breakouts.
For example, we believe that if the LINK price breaks the $10.5 level, the price will continue its downward movement. For this, in the conditional order, we will fill in:
-
Trigger price at $10.5;
-
Order price set at $10.4 by limit request
-
Volume specified at 100 LINK

According to the settings of this order, you can become both a market maker and a taker.
This is a request to buy or sell an asset at a specified price or better. This type of order is used if you want to buy an asset cheaper than the current market price or sell it more expensively.
4.13.5 WHICH ORDER TYPE IS THE CHEAPEST
In futures arbitrage, it is important to save on commissions. If we ignore this fact, we will lose profits, thereby reducing our overall earnings.
Carefully review the commission costs in the commissions section:

By going to this section, you can review the commissions for makers and takers on different markets:

As seen in the figure above, on any market, the most advantageous order will be the one where we are the maker.
For example, opening a spot position of $1000 in LINK with a limit request, we will pay the exchange 0.1% as a maker, which will be $1, instead of 0.18%, where we could be a taker and pay $1.80. Thus, we save $0.80.
In arbitrage, especially active arbitrage, we will often open and close trades, and since the exchange charges commissions for each trade, it is important to choose a profitable order type to minimize expenses.
RECOMMENDATION: In futures arbitrage, we use limit orders due to their simplicity and cost-effectiveness.
4.14 PARAMETERS OF AN OPEN FUTURES TRADE
When opening a futures position, you see many indicators, each of which is important for managing the trade. Let's consider the main parameters using the example of the presented interface:

-
Contract
Here is the selected contract and position parameters. In our example, this is a futures contract for a short position on the LINKUSDT trading pair, using isolated margin with 1.00x leverage.
-
Quantity
Indicates the number of coins in the position. A positive quantity value indicates a long position, and a negative value indicates a short position. In the example, -10.0 LINK is indicated, which indicates a short position for this quantity of coins.
-
Cost
This is the amount for which we bought, expressed in USDT. In our example, it is $109.93 USDT.
-
Entry Price
This is the price at which the position was opened. In the example, the entry price is $10.993.
-
Mark Price
This is the futures market price, calculated based on the futures price, funding rate, and average spot price on major exchanges. In this case, the mark price is $11.025 USDT.
-
Liquidation Price
The price at which the position is automatically closed. In the example, it is $21.876. Upon reaching the specified liquidation price, a loss equal to the margin position amount in this example is $110.0509 USDT.
-
Initial Margin (IM)
The margin (collateral) amount of the open position, which is calculated as the cost divided by the leverage size. In the example, $110.0509 USDT is indicated, which is the collateral for opening this position.
-
Maintenance Margin (MM)
This is the minimum margin required to maintain open positions. In the example, it is $1.22 USDT, which is the minimum amount to prevent the position from being liquidated.
-
Unrealized P&L (ROI)
Shows the profit or loss on the open position. In our example, we have a loss of -$0.32 USDT, which is equivalent to -0.29% of the position cost. This is a preliminary result until the position is fully closed.
-
Realized P&L
This is the profit or loss that has already been realized, including trading commissions and expenses for funding rate accrual. In the example, -$0.0493 USDT is indicated, meaning this amount has already been lost.
-
TP/SL (Take Profit/Stop Loss)
Here you can set automatic position closure at a specified price level to lock in profit or limit losses.
-
Buttons for closing positions by: limit order and market order
On the right side of the interface, there are buttons for closing positions:
-
Limit Order – allows closing the position at a pre-set price by us
-
Market – instantly closes positions at the current market price.
4.14.1 TP/SL SETTINGS AND TRADE CLOSURE
Take Profit – this is a request, upon reaching the price of which the trade will close in profit:
Stop Loss – this is a request with a price, upon reaching which the loss will be fixed

You can set TP/SL when opening a position or after opening in the position section we mentioned earlier:

For example, for an open short position, set take profit and stop loss for LINK:

Thus, according to our settings, upon reaching the LINK price of $10, the entire short position will close in profit, bringing us $9.93 or +9.03%
If the price drops to $13.192, the entire short position will close with a loss of -$21.99 USDT or -20%.
With set TP/SL, these parameters will be displayed in the positions and current orders section:

In addition to the position interface, it is important to refer to the order history and trade history sections.
RECOMMENDATION: We recommend setting a stop loss at an 80% price drop and a take profit at an 80% profit. This is an example of mirror orders that allow maintaining a balance between risk and return. Setting mirror TP and SL on both exchanges helps protect the position from sharp fluctuations and reduces the likelihood of forced liquidation.
4.14.2 ORDER HISTORY AND TRADE HISTORY
Order History – this is a list of all your buy or sell requests (orders). Here you see which orders were executed, which were canceled, and at what price you placed them.

Why this is needed: It helps to understand what happened with your requests – were they executed at the desired price or had to be canceled/changed.
Trade History – this is a list of all completed trades. It displays data on the price and quantity of contracts you bought or sold.

Why this is needed: It helps see which trades actually took place and how much you earned or lost on them.
Both sections are important for futures arbitrage to track your actions, check if trades are executed correctly, and analyze your strategy.
Want to learn more about crypto arbitrage?
Get a subscription and access the best tool on the market for arbitrage on Spot, Futures, CEX, and DEX exchanges.

