What is altseason in cryptocurrency

Altseason is a period when cryptocurrencies, excluding BTC, experience significant growth relative to digital gold and to the US dollar or stablecoins (USDT, USDC). Altseason occurs for various reasons and factors. The good news is that it can be predicted with high accuracy. We have detailed this in this article.
WHAT IS ALTSEASON

Altseason is a period in the cryptocurrency growth cycle when liquidity flows from Bitcoin to altcoins. This event is characterized by a decline in Bitcoin's dominance and an increase in the market capitalization of all altcoins.
Altseason is accompanied by the growth of most altcoins, with new all-time highs (ATH) being set and higher returns in percentage terms and in dollars compared to Bitcoin.
WHEN AND HOW DOES ALTSEASON BEGIN
Historically, altseason occurs after the Bitcoin season. This is due to the decline in Bitcoin's growth potential when digital gold no longer sets new highs. The capital earned by investors and traders in BTC flows into altcoins to achieve greater profits.
Market participants, seeing that altcoins are beginning to grow, which means capital is moving towards altcoins, become part of this movement. Increased demand for altcoins drives their prices higher and higher.
Unfortunately, even the most experienced analyst cannot predict how soon altseason will end. Markets, as we know, are cyclical. Cyclicality is based on alternating bear and bull trends.
A bull market, or upward trend, occurs when buyer strength outweighs sellers. In contrast, a bear market, or downward trend, is accompanied by seller dominance.
The most favorable environment for altcoins is a bull market. During this period, capital moves towards riskier assets, causing most altcoins to grow.
The entire capital movement process can be illustrated in the diagram below
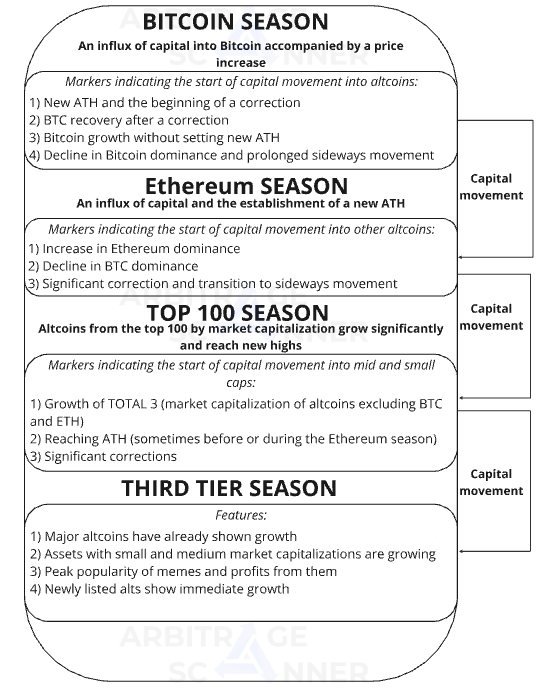
Let's examine each stage of capital movement in detail
PREREQUISITES FOR ALTSEASON AND BITCOIN DOMINANCE
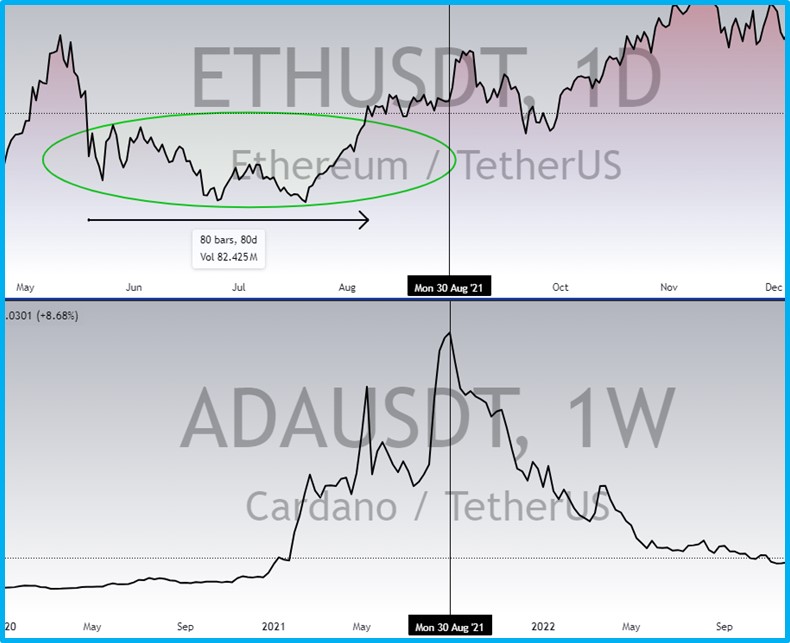
After significant growth in Bitcoin and the setting of ATH, a correction begins for digital gold. During this time, Ethereum gains weight and shows rapid growth. These events occur due to the decline in BTC dominance.
The graphs below illustrate this
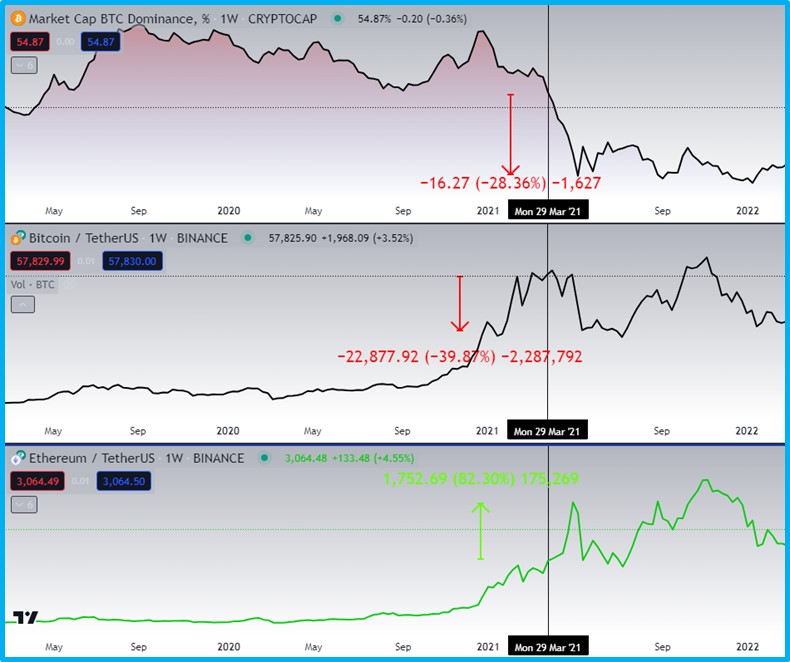
Thus, in March-April 2021, Bitcoin set an ATH. Afterward, we saw a correction, and simultaneously, Bitcoin dominance decreased, and Ethereum rose.
HOW ETHEREUM'S GROWTH AFFECTS ALTSEASON
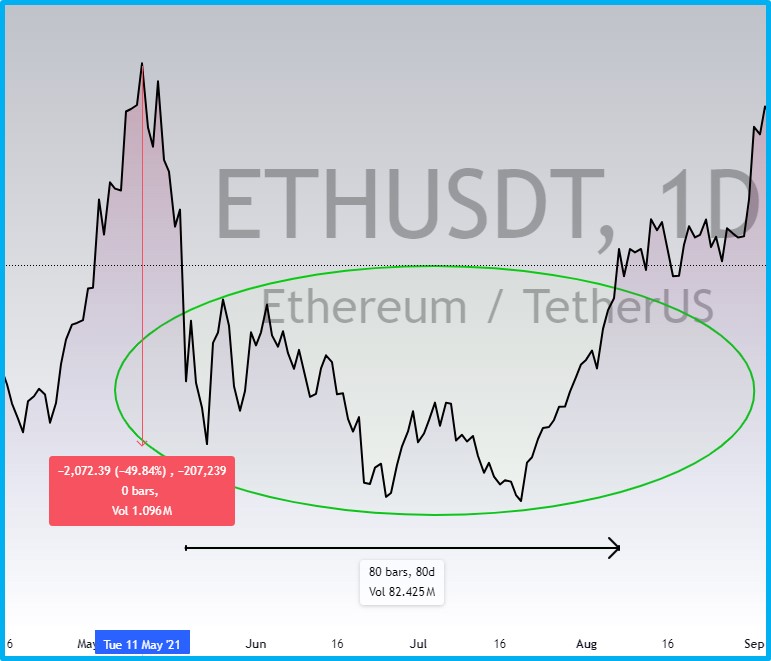
The inflow of capital into Ethereum provokes strong growth in the second-largest cryptocurrency after Bitcoin. This is followed by a significant correction and a prolonged sideways trend.
The picture below shows Ethereum's price movement for May 2021
GROWTH OF THE TOP 100 CRYPTOCURRENCIES
After Ethereum's price movements (Fig. 3), capital flows into large-cap altcoins. During this time, buyers acquire cryptocurrencies from the "top 100 by market capitalization" due to their greater growth potential.
Altcoins from the "top 100 by market capitalization" begin strong movements when Ethereum tests its peaks again.
As Ethereum approaches its all-time highs, many top 100 cryptocurrencies see strong reactions and even surpass previous highs.
NOTE: altcoins, including those from the "top 100 cryptocurrencies," may set ATH before the growth of ETH or during its parabolic phase. Historically, most altcoins have shown their peaks within a quarter after Ethereum's ATH.
MEME COINS AND ALTSEASON
After the growth of the "top 100 cryptocurrencies," large capital movement shifts towards meme coins as well as small and mid-cap altcoins. Meme coins become the culmination of altseason, showing incredible growth from several hundred percent to over a thousand.
For example, the meme coin Doge grew by +97% in a week
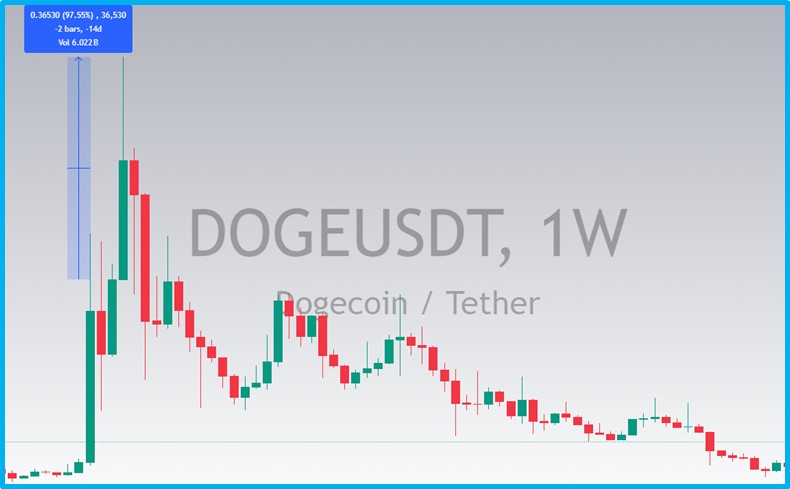
RECOMMENDATION: stay vigilant when you see meme coins rising one after another. Smart capital attracts many new retail players to exit the market with the help of additional buyers.
HOW TO DETERMINE ALTSEASON
Understanding when altseason has started is the main task for an investor or trader aiming to maximize market returns. Fortunately, there are very accurate metrics we will discuss below.
WHAT IS THE ALTSEASON INDEX
The altseason index from Blockchaincenter.net will help you understand what altseason is. The idea behind it is that a big movement in altcoins begins when 75% of the top 50 coins by market cap show a higher percentage growth than Bitcoin in the last quarter.
For instance, if the altseason index shows a value of 80, it means that 80% of the "top 50 coins by market cap" have grown more than Bitcoin in the last 90 days.
The higher the altseason index, the stronger the altcoins' lead over BTC:
- 0 – 45 means Bitcoin season
- 45 – 55 means parity in growth
- 60 and above indicates a trend change
Additional confirmation that altcoins have started their run is the maintenance of the altseason index at high levels.
NOTE: stablecoins and wrapped tokens are excluded from the "top 50 coins".
For example, the altseason index is currently at 24

WHAT IS BITCOIN DOMINANCE
We discussed Bitcoin dominance in detail in this article. This index represents the ratio of Bitcoin to the capitalization of all cryptocurrencies. Like any index, it is expressed as a percentage, so the obtained value needs to be multiplied by 100 percent. When Bitcoin dominance decreases, capital flows from digital gold into other assets.
Below are the options for altcoin movement with changes in Bitcoin dominance
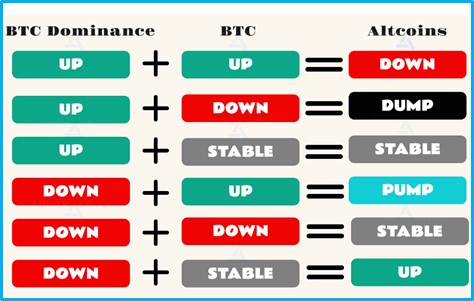
The most favorable situation for altcoins is when BTC dominance decreases simultaneously with Bitcoin's growth. Then, significant movement in the altcoin market occurs.
WHAT IS THE FEAR AND GREED INDEX
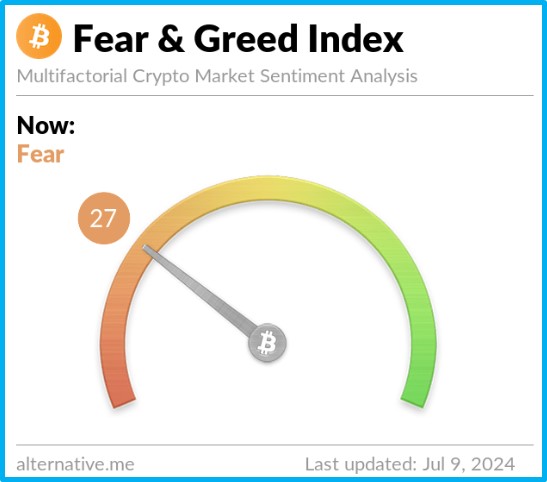
You can learn more about the Fear and Greed Index in this article. This index summarizes market indicators and sentiments. Using a 100-point scale, it determines what emotion traders and investors are feeling in the market.
In the last cycle, in 2021, this index reached values over 85 points. During this period, extreme greed prevailed, driving a surge of new buyers and, consequently, an increase in altcoin prices.
NOTE: Stay vigilant when the Fear and Greed Index enters extreme greed territory, as this can signal the beginning of a correction and an exit from positions.
HOW MARKET CAPITALIZATION AFFECTS ALTSEASON
Market capitalization, particularly of altcoins, can hint at when altseason might begin. Market capitalization significantly increases when liquidity enters the market. This can be due to important geopolitical, economic, or other events.
You can monitor altcoin capitalization yourself. Use the TOTAL 2 chart (which shows the capitalization of all altcoins excluding BTC) and the TOTAL 3 chart (which shows the capitalization of all altcoins excluding BTC and ETH).
NOTE: Market capitalization on the TOTAL 2 and TOTAL 3 charts includes stablecoins, which are regularly printed, significantly affecting capitalization.
You can use an index that excludes the capitalization of stablecoins.
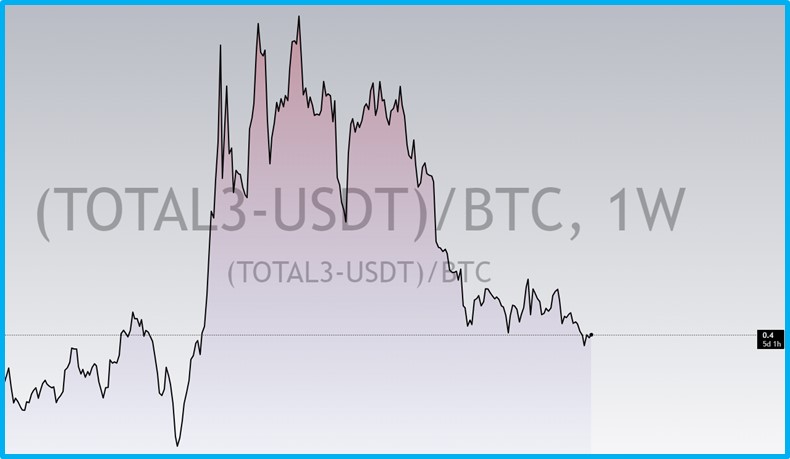
Many traders and investors are often unaware of it, but it provides "clean" data. Incidentally, we recently updated the extreme (minimum value) on the index in Fig. 9.
CONCLUSIONS
Altseason presents enormous profit opportunities, but its stages are often associated with increased volatility, which can lead to undesirable losses.
By studying capital movement, you will be aware of which stage of altseason the market is in. The altseason and Bitcoin dominance indexes will help you better understand market dynamics. At the same time, the Fear and Greed Index will tell you whether the market is overheated or undervalued.
NOTE: Please adhere to risk management and money management principles.
Want to learn more about crypto arbitrage?
Get a subscription and access the best tool on the market for arbitrage on Spot, Futures, CEX, and DEX exchanges.


