Moving Averages in Crypto Trading: The Ultimate Guide

with ArbitrageScanner!
Although cryptocurrency prices can be unpredictable, many lines can appear random to a trader. A trader will want to remove as much 'noise' as possible to identify the overall trend in the price action. One tool used in technical analysis (TA) to help traders understand the overall price direction is moving averages (MA). When calculating a moving average, you take the average price of an asset over a specific time period. All traders need to have a good understanding of the various types of moving averages because they will help develop solid trading strategies regardless if you are trading Bitcoin or another altcoin.
Moving Average Fundamentals
Core Concept and Signal Generation
A moving average is a technical analysis (TA) indicator used to show an asset's average price over the previous period of time. Since this indicator is lagging, it will show you what has happened with the asset based on past prices, but also where the asset's price is now in relation to its average price. In this way, a moving average indicator provides insight into what future prices may look like, as well as where support and resistance levels will be.
Common Timeframes and Price Smoothing
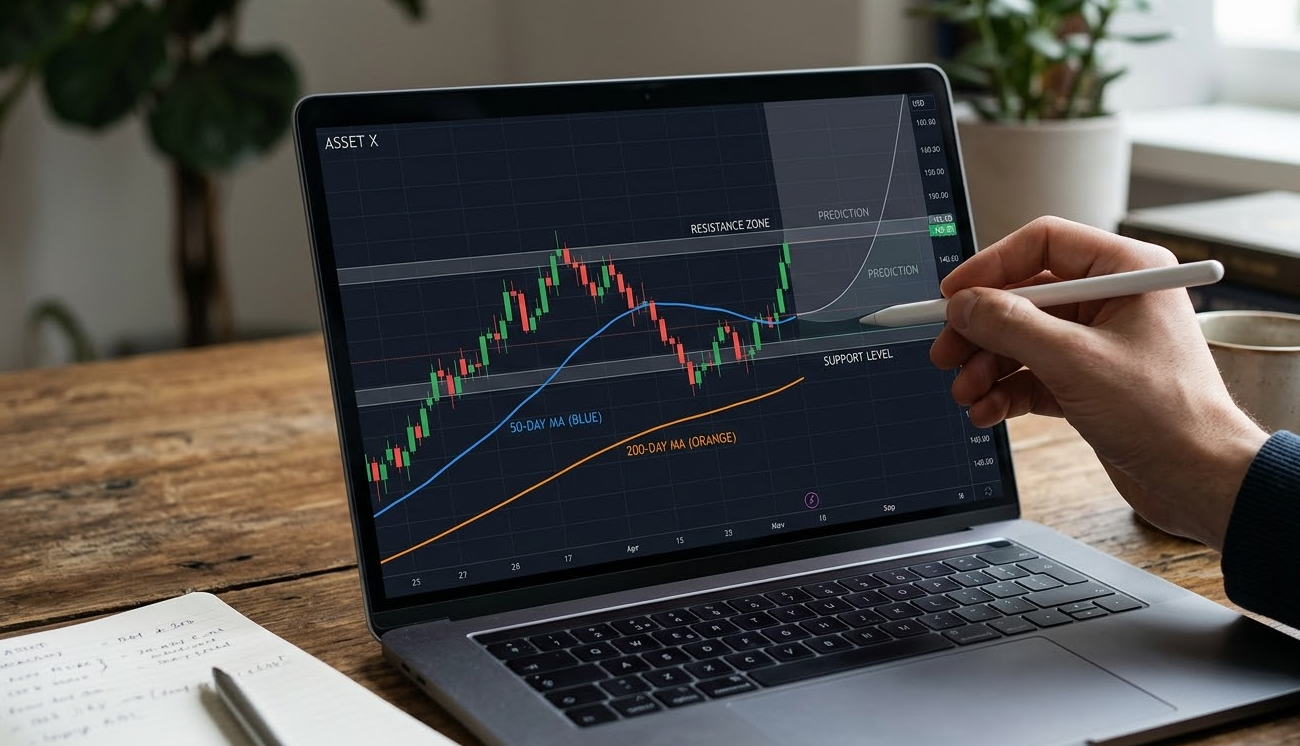
Short-term traders usually use MA's calculated using the number of days prior to the prevailing time frame: 10-Day, 20-day, or 50-day MA. Long-term traders use the 200-day MA as the industry standard MA today. If the most recent close of an asset's price is above the current MA, the overall market is bullish. If the last close of the asset is below its current MA, the market is currently considered to be bearish.
Simple Moving Average (SMA)
The SMA is the most simplistic type of moving average calculation and is created by taking the closing prices for a specific time period (SMA Period) and averaging them (i.e., adding the total number of closing prices of a specific time period and dividing by the number of days).
To illustrate, a fifteen-day moving average is calculated by totaling the previous fifteen closing prices and dividing this amount by fifteen. The calculation itself is straightforward, but a simple moving average (SMA) can also be very useful for recognising changes in long-term trends in both stock and crypto markets. Traders will use an SMA to identify a bullish crossover (when the shorter-term average has risen above the longer-term average), or a bearish crossover (when the opposite occurs), thereby signalling an opportunity to enter or exit a position.
Advanced Moving Averages
While it is an acceptable method, the simple moving average will treat all data points equally for purposes of establishing the moving average. Because a fast moving market such as crypto will generally favour traders who can react to price movements more quickly than through the use of the SMA, many traders prefer tools with greater sensitivity to current prices.
Exponential Moving Average (EMA)
The EMA is a moving average that places greater weight on the latest data, and therefore produces a moving average with less lag than the SMA. As a result of the reduced lag inherent in the EMA, many day traders prefer to use the EMA rather than other moving averages. Thus if the price of Bitcoin experienced an extreme one-day increase, a moving average would be significantly more responsive to price changes when calculated using the EMA than when calculated using the SMA.
Double Exponential Moving Average (DEMA)
The DEMA is the next level of sophistication for those looking to reduce the lag associated with traditional indicators, as it uses two different EMA's to compute the DEMA. The DEMA produces much more accurate signals in today's extensive volatile market conditions because it utilises significant price movement as input to the computation of the DEMA, which allows traders using short-term moving average strategies to come up with successful trading strategies.
Adaptive Averaging Systems
Standard averages typically do not produce satisfactory results under sideways/non-directional (ranging) market environments. Adaptive indicators adapt their degree of sensitivity relative to current market conditions.
KAMA Average (Kaufman's Adaptive Moving Average): This type of average, known as the KAMA average, will pace itself at a different rate based on the degree of market noise present in either direction i.e. if there was excessive volatility to market without a clear defined trend then KAMA would slow down, but if prices were trending consistently in one direction, then KAMA will increase its rate of change.
MESA Average (MESA Adaptive Moving Average): The MESA average is an adaptive moving average created by John Ehlers that operates by adjusting to the repetitive nature of price movements to give an always current view of the average price based on price data created to date. The smoothness of the MESA average allows for this calculation to be performed consistently and will allow you to determine if a price will continue towards its trend established over a longer period of time.
Hybrid Indicators: MACD Analysis
MACD, or Moving Averages Converging Diverging, is a hybrid technical indicator that is used as an oscillating momentum indicator when a short-term EMA crosses a long-term EMA. MACD also generates its oscillating indicator as a histogram with a signal line.
The MACD zero line is not a numeric threshold — it indicates whether momentum is positive or negative. Traders can therefore use a moving average to confirm that a rising trend is not a temporary 'fake out', but a genuine and sustained move.
The Bottom Line
There are several types of Moving Averages, there is not a single "best" moving average because each will produce results that will be relative to the trader's trading style. For technical analysis of macro trends, it's essential to have a 200-day simple moving average (SMA) as a long-term moving average, while an exponential moving average (EMA) is more suited for intra-day trades or traders. Being patient is necessary to utilize a moving average effectively as they will not provide crystal ball-type projections of the market but will serve to provide confirmation of trends through a continuously calculated average view of the market, allowing you to trade based on evidence and not emotion.
Frequently Asked Questions
How to choose the most suitable moving average type for different market conditions?
Use an EMA or an SMA during trending markets. During a noisy or volatile market, using an adaptive moving average, such as a Kaufman Adaptive Moving Average (KAMA), is best because it eliminates false signals. If you are day trading, use shorter time periods, typically between 10-20, when determining your moving averages.
What are the optimal timeframe combinations for moving average strategies?
The "Golden Cross" method employs both a 50-period moving average and a 200-period moving average; for short term traders, a common moving average strategy involves using a 9-period EMA combined with a 21-period EMA to determine potential entry points.
How do moving averages perform in high volatility crypto markets?
Movements of price within high volatility often result in false trading signals being generated from moving averages; therefore, traders should confirm signals using additional indicators such as RSI and VWMA.
What are the key differences between adaptive and traditional moving averages?
A traditional moving average will have a fixed amount of lag; adaptive moving averages, however, will alter their calculation method depending on whether the price is trending or ranging, which makes them more relevant when trading Bitcoin.
How to combine multiple moving averages for more reliable signals?
Many trading strategies utilize a "Ribbon" or "Crossover" approach; in this case, traders can combine multiple moving averages to identify key support and resistance levels. You can use numerous types of varying moving averages on your chart to see the entire picture of key levels of support and resistance.
Want to learn more about crypto arbitrage?
Get a subscription and access the best tool on the market for arbitrage on Spot, Futures, CEX, and DEX exchanges.

You might be interested
Understanding Support and Resistance in Crypto Trading

Supply and Demand in Crypto Trading: The Ultimate Trader's Playbook

Essential Cryptocurrency Trading Tools: Complete Guide
