Understanding Support and Resistance in Crypto Trading


with ArbitrageScanner!
The fast-paced market of 2026 digital assets means using the core principles of price action is extremely important for a successful trading system. At the center of technical analysis, there are two basic principles: support and resistance. These levels create a picture of the market—the map of where buyers and sellers are the most active. Being able to identify these critical levels of price action allows traders to react to price movement and make more informed trades instead of just being reactionary to noise from the market.
Understanding Core Concepts
Support Levels Explained
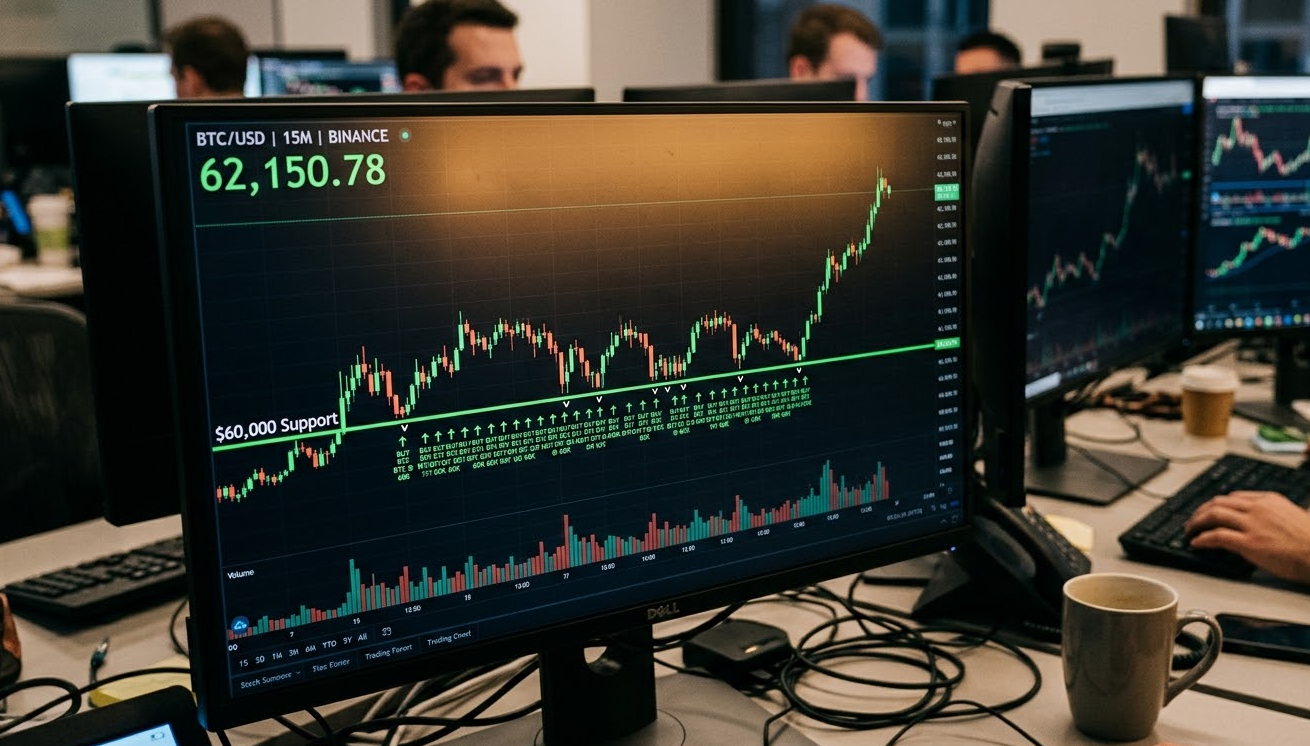
The support level can be likened to the "floor" of Bitcoin or any crypto asset's price. It is the level at which the buying pressure is greater than or equal to the selling pressure, thereby not allowing the price to drop any lower. When the price touches the support zone, buyers see the price as a good value to buy from and creates a surge of buyers and prospective buyers for that price area. For example, if Bitcoin has hit the $60,000 area multiple times and jumped back, then that price will be seen as a strong support area.
Resistance Levels Explained
A resistance level can be likened to the "ceiling" of a price. Because the selling pressure is greater than or equal to the demand at that level, the price cannot continue to increase until it breaks through that ceiling. When traders expect to sell their order at the level of resistance, they anticipate the price will fall or reverse direction. In a bull market, they will break through that level of resistance eventually, but prior to breaking through that level of resistance, the price represents a significant barrier known as the consensus of the marketplace for an expensive crypto asset.
Identification Methods
Technical Analysis Tools
Identifying levels of support and resistance in a market requires more than just an objective assessment of a bar chart. The use of Technical Indicators such as Fibonacci Retracement and Pivot Points are extremely useful when visually analyzing a market. Bitcoin's pivot points are determined using the high, low, and close price of the previous day, producing an objective major technical level. Using screeners that include barchart capabilities, you can identify pivot points across multiple cryptocurrencies such as Ethereum and BTC at the same time.
Historical Price Patterns
The historical price action represents support and/or resistance and is the most reliable indicator of where that support or resistance lies. The more times price touches or moves off of a specific price point without breaking through that price level, the more support or resistance that level will establish. Support and resistance levels are considered the "market memory". For example, if BTCUSD peaks and falls sharply, that peak subsequently becomes a resistance level if the price tries to get back to that price level again.
Moving Average Usage
Moving averages are dynamic indicators that also provide a level of support and/or resistance. During a strong uptrend, the 50-day moving average and the 200-day moving average form a strong area of support. Conversely, if the market is in a downtrend, moving averages typically become an area of resistance and begin to trend lower. Many traders wait until the price reaches a moving average before entering into a trade in the same direction of the trend.
Verification Techniques
Not all lines on the chart are considered to be a significant support level. A good way to verify a level is to check the volume traded. It is essential that high volume accompanies a true reversal or breakout price movement. Another technique to be used for a verification method is the RSI; an RSI above 70 may indicate that there is a potential overbought condition and exists near an area of resistance. Conversely, an RSI below 30 may indicate that the market is in an oversold condition and exists near an area of support. You may set alerts through your internet browser of choice to notify you as each of these levels are approached.
Common Identification Mistakes
Typical identification errors include treating levels like definitive numbers rather than ranges of support and resistance, overlooking the larger time frames i.e. using 5 minute charts, yet ignoring the daily core levels, overcomplicating the chart with an excessive amount of indicators and not calculating standard deviations or ranges of price movements that could lead to stop-loss chasing.
Trading Strategies
Bounce Trading
The premise behind bounce trading involves buying when a price hits a support level and indicates that it’s reversing. The intent is to capitalize on the price increase created by the bounce off of the "floor". It is transitioning from bearish to bullish and your entry will be placed right above the support level, with a stop-loss just below it, thereby managing risk.
Breakout Trading
Breakout trading occurs when the price breaks above a level of resistance or below a level of support. If Bitcoin was to break through a multi-month level of resistance (thereby removing selling pressure), it normally results in a very large move upwards in price. Traders will look for a close above the level to confirm the price will maintain this directionality.
Implementation Guide
Market Analysis Framework
Prior to implementing a trading strategy, it is important to have a framework for market analysis. A good place to start would be macro market analysis (i.e. what is the largest trend; up or down?). Research and due diligence must be done to analyze external factors (such as ETF inflows or currency fluctuations) that could help push prices through key levels.
Level Identification Process
- Open your crypto chart on a daily or weekly basis
- Identify the clearest and most obvious high and low points. Identify support and resistance areas by drawing zones that have been tested at least two times.
- Use Fibonacci tools to find areas where price has retraced to levels that are in alignment with those of previous prices.
- Make sure to have good risk management techniques in place beforehand!
- Enter trades only with an entry and exit plan! If support is breached, the price may drop to the next major level. Since cryptocurrency prices change rapidly, using stop-loss orders is not something to be taken lightly! Good risk management will make sure that you do not lose your entire account because of a single bad price retracement.
Conclusion / The Bottom Line
At this point of the article I am going to summarize. A good strategy for finding support and resistance will rely on determining where buyers-to-sellers have shifted from one side of the market to the other while giving you the tools to be able to safely trade in and out of Bitcoin price movements (whether you are buying low or selling high).
Frequently Asked Questions
How do different market conditions affect the choice between fixed and trailing stop strategies?
In terms of market conditions, which are the best assets to use fixed and/or trailing stop strategies on? Use trailing stop orders for capturing maximum profits in a market that is trending up; fixed stop orders will do a better job of preventing minor fluctuations in a relatively stable, bounded market from stopping you out.
What percentage should be used for trailing stops in different volatility environments?
As an example, you would typically trail 3-5% on Bitcoin, but on the more volatile altcoins, you may need to trail somewhere between 10-15% based on what has historically been considered common price movement ranges.
How to combine both profit-taking strategies in a single trading plan?
What would be the best method to combine both take profit measures into the same trade plan? Professionally, many traders will have a hybrid take profit plan : take 50% of the profits when the price reaches a given price target, which may represent resistance level, and then set a trailing stop order on the remaining 50% of their position in order to potentially capture any subsequent breakout that may occur above their initial price target.
What are the best practices for settin g take-profit levels in trending markets?
In a trending market, where do you set profit taking targets at? Typically, buyers will be taking profit at or immediately prior to reaching the next major resistance level. A good practice is to use volume to help confirm whether there is enough strength in the current trend in order to warrant setting a target the way you have.
How to adjust profit-taking strategies for different cryptocurrency pairs?
How do you determine your target ranges for taking profits when trading different pairs of cryptocurrencies? Cryptocurrency pairs that are less stable (for instance, BTCUSD) will typically require tighter targets on profit taking, whereas the more volatile and/or illiquid coinage, you will likely be required to widen the zones of support and resistance in order to accommodate a lower liquidity level and higher slippage.
Note: The information provided in this article is for informational purposes only. Always perform your own due diligence prior to trading, investing, or making financial decisions based upon information from this website. For more advanced tools, try a free 30-day trial of premium charting software (search for a program that meets your needs).
Want to learn more about crypto arbitrage?
Get a subscription and access the best tool on the market for arbitrage on Spot, Futures, CEX, and DEX exchanges.

You might be interested

How to Lock in Crypto Trading Profits: Key Strategies

Supply and Demand in Crypto Trading: The Ultimate Trader's Playbook

Essential Cryptocurrency Trading Tools: Complete Guide
