Exponential Moving Average (EMA)

with ArbitrageScanner!
Exponential Moving Average (EMA)
What is the Exponential Moving Average (EMA)?
The Exponential Moving Average (EMA) is a technical analysis tool that shows how an asset's price has changed over time. The EMA is more sensitive to short-term market changes than the Simple Moving Average (SMA) because it places greater weight on recent price data.
The EMA is similar to a Weighted Moving Average (WMA) as it also gives more importance to recent data points. However, the EMA does this exponentially, whereas the WMA applies weight in a linear fashion.
How is the EMA Calculated?
The Exponential Moving Average (EMA) is an indicator that gives more weight to recent price data, allowing it to react faster to market changes. The calculation is performed in steps:
1. Determine the multiplier (smoothing factor)
Formula:
Multiplier = 2 / (N + 1)
Where N is the selected period (e.g., 12 or 26). The shorter the period, the larger the multiplier and the more sensitive the EMA.
2. Calculate the initial EMA
The initial value is taken as the Simple Moving Average (SMA) for the chosen period.
3. Calculate all subsequent values
Formula:
Current EMA = (Closing Price – Previous EMA) × Multiplier + Previous EMA
Here, Closing Price is the closing price of the current period, and Previous EMA is the EMA value of the previous period.
How Does the EMA Work?
The primary function of the EMA is to smooth out price data to show a clearer trend. By giving more weight to recent prices, it reacts faster to new information than the SMA. When the price is above the EMA line, it generally indicates an uptrend. Conversely, when the price is below the EMA, it suggests a downtrend. Traders use this indicator to confirm trends and identify potential trading opportunities.
How to Use EMA in Trading?
There are several key applications for Exponential Moving Averages (EMAs) in cryptocurrency trading. One of their main roles is to help traders understand what is happening in the market. You can get a better idea of where cryptocurrency prices are heading by looking at both short-term and long-term moving averages. A short-term moving average rising above a long-term one usually signals an uptrend, while the opposite movement suggests a downtrend. This visual information helps people decide when to buy or sell.
Another important function of the EMA is to smooth out market noise. By giving more weight to recent prices, EMAs filter out minor price fluctuations and show a clearer picture of the overall market movement. This is especially useful in the volatile world of crypto, where short-term changes can easily obscure the bigger picture.
Furthermore, EMAs can provide you with trading signals. When two moving averages with different periods cross, they can give you clear signals on when to enter and exit a trade. Some well-known examples are the basic moving average crossover, the bullish "Golden Cross" (when a short-term EMA rises above a long-term EMA), and the bearish "Death Cross" (when it drops below). These qualities make the EMA an indispensable indicator for building solid crypto trading plans.
Trading Strategy Based on the 12-EMA and 26-EMA
A popular strategy involves using the 12-period EMA and the 26-period EMA. This combination is the foundation of the Moving Average Convergence Divergence (MACD) indicator.
-
Buy Signal: When the 12-EMA crosses above the 26-EMA, it indicates growing bullish momentum. This is often interpreted as a signal to enter a long position.
-
Sell Signal: When the 12-EMA crosses below the 26-EMA, it suggests increasing bearish momentum and can be seen as a signal to sell or open a short position.
The 5-EMA and 8-EMA Crossover Strategy
This strategy is for short-term or day trading, using even faster-reacting EMAs.
Crossover A
When the 5-EMA (a very short-term trend) crosses above the 8-EMA, it signals a potential short-term uptrend, suggesting a buying opportunity.
Crossover B
When the 5-EMA crosses below the 8-EMA, it indicates a potential short-term downtrend, suggesting a selling opportunity.
Pros and Cons of the Exponential Moving Average
Pros
-
Responsiveness: Reacts quickly to recent price changes, providing timely signals.
-
Trend Identification: Excellent for confirming the direction and strength of a trend.
-
Reduces Lag: Has less lag than the SMA, making it more suitable for short-term trading.
-
Versatility: Can be used across different timeframes and in various trading strategies.
Cons
-
False Signals: Its high sensitivity can lead to false signals during volatile or sideways markets.
-
Lagging Indicator: Like all moving averages, it is a lagging indicator based on past prices and cannot predict future movements.
-
Ignores Price Gaps: The EMA treats price data as a continuous stream and does not account for gaps, which can lead to inaccuracies.
EMA vs. Simple Moving Average (SMA)
The main difference between the EMA and SMA is the calculation method and sensitivity. The EMA gives more weight to recent prices, making it react faster to price changes. The SMA gives equal weight to all data points in the period, resulting in a smoother line that is slower to react.
-
Use EMA for short-term trading and when you need a responsive indicator that captures recent price action quickly.
-
Use SMA for long-term trend analysis and when you want a smoother indicator that filters out short-term noise.
Frequently Asked Questions
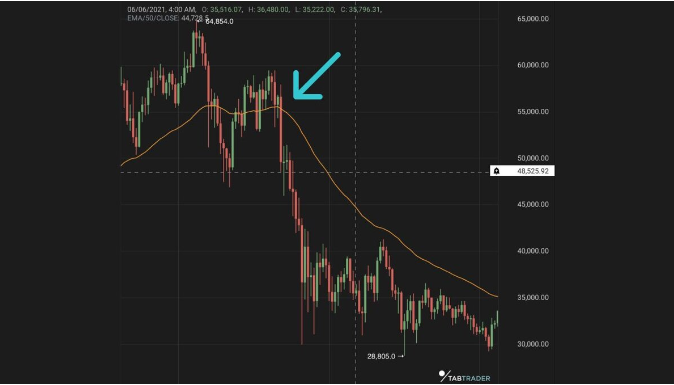
What does the 50-day moving average signify?
The 50-day moving average (often a 50 EMA) is a widely watched indicator representing the medium-term trend. If the price is above the 50 EMA, the medium-term outlook is generally considered bullish. If it's below, the outlook is bearish. It often acts as a dynamic support or resistance level.
In which cases is EMA preferable to SMA?
EMA is preferable in volatile markets or for short-term trading strategies where quick reactions to price changes are crucial. It is also favored by traders who want to reduce the lag inherent in moving averages.
How do you set up EMA for swing trading?
For swing trading, traders often use medium-term EMAs like the 20-period and 50-period EMA. A common strategy is to look for the 20 EMA to cross above the 50 EMA as a buy signal and cross below as a sell signal, confirming the medium-term trend direction.
Conclusion
The Exponential Moving Average is a powerful and flexible tool for crypto traders and investors. By placing more emphasis on recent prices, it quickly reveals market trends and provides clear trading signals. However, like any technical indicator, the EMA is not perfect. It can produce false signals, miss price gaps, and cannot predict future price movements. The best way to use the EMA is to combine it with other indicators that measure momentum or volume and to ensure it aligns with proper risk management. When used carefully, the EMA helps traders make data-driven decisions and stay informed about both short-term changes and long-term market trends.
Want to learn more about crypto arbitrage?
Get a subscription and access the best tool on the market for arbitrage on Spot, Futures, CEX, and DEX exchanges.

You might be interested

Divergence in Trading: How to Find and Trade It Correctly

Algorithmic Trading: How to Trade with Rules, Not Emotions

Algorithmic Trading: How to Create a Trading Bot and Not Lose Money

The best indicators for cryptocurrency trading in 2024

The basics of risk management and money management in cryptocurrency trading
