Reading Funding Rates the Right Way: Why LIT Stayed Positive Through a 20% Crash

with ArbitrageScanner!
The difference between funding rate and price direction is probably the most commonly confused "funding rate" mistake by traders. For example, LIT (the governance token for the "perp-DEX") on June 6-8, 2026, LIT was rejected at the resistance level of $1.80 and fell approximately 20%, but its perpetual funding reportedly remained positive (as "longs continued to pay shorts" even as prices fell). This example demonstrates a one-sided (crowded longs positioned to take advantage) rather than a bullish market. Additionally, a delta-neutral trader does not derive price direction from the funding rate; they only derive which party is paying which party and taking the payment while maintaining their market neutrality.
Funding rate is the most frequently quoted but least understood number on a perpetual futures display. Traders see a positive funding rate and make the assumption that the market is bullish, but then prices drop 20% while the funding remains positive and they think the signal has failed; however, the funding level is not a broken signal; rather the reader just misread the signal.
The best example of this error was actually LIT or the governance token of the Lighter perp-DEX. As previously noted, LIT was rejected as of June 6-8, 2026 at the resistance level of $1.80 and fell approximately 20%, whereas the perpetual funding for LIT remained above the equilibrium point, indicating the longs were continuing to make payment to the shorts to maintain their respective positions despite LIT depreciating in value. If you viewed the funding level through the lens of "positive funding would yield an increase in price," the above example would not make sense. In contrast, when viewed through the correct lens of what funding actually measures, the above example is clear as day.
The overall intent of this article is to identify and clarify the distinction between the two signals: Funding Sign (who pays whom) versus Price Direction (direction of chart movement). We will discuss what funding is; why positive funding via a crash occurs; how each sign/direction combination indicates what a market-neutral trader uses the number for.
Understanding Funding Rates
Perpetual futures have no expiration date, meaning there are no forces driving price convergence between a perpetual future and spot other than the funding rate itself. A funding rate causes the convergence of price by providing periodic payments directly to traders as opposed to being paid to an exchange in order to keep the price of perpetual futures tied to that of their underlying asset.
For example, if the price of a perpetual future is higher than the spot price (e.g., trading at a premium), positive funding means that longs will pay shorts. Conversely, when the price of a perpetual future is lower than a spot price (e.g., trading at a discount), negative funding means that shorts will pay longs. Therefore, the size of the funding payment serves as an incentive for traders holding the crowded side of a trade (long or short) to take the opposite position in order to bring the perpetual future trading price back to the spot trading price.
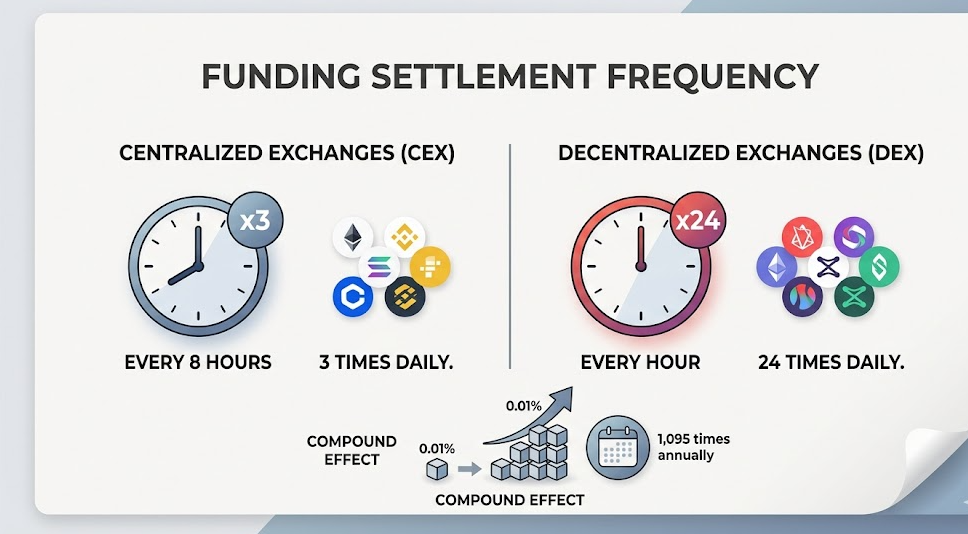
Two additional practical details worth noting include the settlement frequency and the magnitude of the funding number. Funding rates are paid every eight hours on most central exchanges versus every hour on some recent DEXs (such as Lighter, which pays funding directly peer-to-peer between longs and shorts). While the magnitude of the funding rate alone may be 0.01% on both BTC and PCI, the compound effect of making these payments occurs approximately 1,095 times annually. One point most readers overlook: the funding rate is fundamentally a gauge of positioning pressure, rather than a prediction of where prices will go. It indicates which side is at capacity and will pay to maintain their position (positionally) — which is not a prediction of price movement.
The mistake: reading funding as a price prediction
The common fallacy is to interpret the funding rate as a price prediction. The flawed intuitive mental model is as follows: when funding is positive, there are a lot of long positions, therefore, the price must go up, so funding at a given time is bullish. Each of these three conclusions might be reasonable to some, but they are far from reliable conclusions.
When the funding rate is positive, it means that, at that point in time, there are more long positions than short positions and that therefore the buyers of long positions are bidding against buyers of short positions. The presence of many leveraged long positions is typically an indication of a contrary position; therefore, it would not constitute support for a long position. Once all the participants who wanted to be long have already done so, this means that there is little or no buying pressure remaining and the highly concentrated long position is vulnerable: if prices were to move downward, there could be a liquidation of long positions, which would create forced selling of long positions and, in turn, cause the price to decline even further. Therefore, a funding rate that has consistently remained positive over a period will typically indicate that prices are about to decline, rather than appreciate.
In this regard, the funding rates related to the LIT episode provide some clarity in terms of how funds moved through the market.
June 2026: Funding remained positive despite ~20% decline in the price of LIT
In early June 2026, the LIT order book showed a significant amount of resistance at $1.80 and the price of LIT had started to roll over. However, a large percentage of traders anticipated a bounce and maintained long positions, leverage and confidence that the price of LIT would not fall below $1.80. As the price of LIT fell, only a portion of those traders acted and closed out their positions and, effectively, were long going forward because they held their long positions in the hope that they would ultimately be supported by price appreciation. There was also some additional information.
Longs were effectively paying shorts to keep their long positions even after the price dropped. The continuously positive funding shows that there were too many long traders and they were too stubborn. Funding can't tell you if price will go up!
Some things that are important here – LIT's monthly perp volume has fallen from a peak of approximately $232 billion in December 2025 to around $39 billion, an ~83% drawdown, as Season 2 farming incentives came to an end. This caused reward-chasing traders to rotate to other venues for opportunity. Less incentive-driven volume results in greater price volatility, which means that the relative balance of long and short positions in the market can stay skewed towards one side of the market longer due to fewer new traders coming into the market to take positions opposite of the existing long traders. Major fallouts from long-sides occur much more often under these conditions.
Therefore, the lesson is not that "Funding lied." The lesson is that there is an independent axis for the funding sign and price direction, and the true story lies in their unique combinations to provide insight about market positioning.
The four sign-versus-direction scenarios
Two dimensions exist based on the funding sign vs. direction. Funding should no longer be interpreted as an oracle regarding future direction. The 2 dimensions of funding sign and price movement create a 2x2 matrix allowing traders to determine the different types of market positioning based on those 2 variables.
| Funding Signal | Price Movement | Implication for continued movement | Possibility of continued movement |
|---|---|---|---|
| Positive - Longs pay | Price Going Up | Trend verified via leverage | Both Longs Winning & Paying |
| Positive - Longs pay | Price Going Down | Crowded Longs in Denial / Leaning on Drop (LIT example) | Possibility of long liquidations through capitulation that could clean out long traders |
| Negative - Shorts Pay | Price going down | Increased trend verification through leverage | Shorts winning & paying |
| Negative – Shorts pay | Price Going Up | Crowded Shorts are in denial | Currently working against the trend |
The two diagonal Funding Signal Types show that there are winning traders on the same side of the trade as well as those that have recent experience that verify that they are winning. In most cases, this leads to an increase in momentum for all.
The two funding Signal Types not diagonal have some equivalent or similar characteristics but with a very different outcome for the trader that is losing or otherwise struggling with the trade. The example of long traders "caught" in a long position at LIT in 2016 shows an exact example where a long trader's denial and stubbornness put them directly into the "positive funding/collapsing price" quadrant.
What this means for a delta-neutral trader
The implication of this information is very important for those traders that operate in a delta neutral manner.
The delta-neutral trader operates to either; hedge or offset their trading positions but are otherwise not concerned with the final outcome of the asset(s) they hold. They operate under the same conditions and circumstances established by these signals relative to the trends of the markets and the outcome of the particular trades he/she holds. The delta-neutral trader will choose to hold equivalent long or short positions until realized or until the closing of their last trade. This comes from the funding payment.
For the trader, the funding sign is a way to generate revenue and is not a predictive signal to act on. The usual funding-capture structure (cash and carry) looks like this:
- When funding is positive, shorts receive the benefit of funding payments. Thus, the short trader maintains an open position in the spot market (or long position in another market) and short sells the perpetual contract against the existing position. The trader collects funding payments on every funding interval while the net price exposure remains close to zero.
- When funding is negative, the long trader receives the benefit of funding payments. Thus, the long trader today sells the perpetual contract and buys the spot position and collects their funding from the short trader.
From this perspective, the funding in LIT in June 20, 2026, was not an indicator to a delta-neutral trader; it was the set-up. The continuous receipt of positive funding payments from longs on LIT while the price falls will continue to provide the short trader with funding receipts from the perpetual position. The delta-neutral trader's losses due to the price decline in LIT will not be realized because the spot position will be moved in the opposite direction from the short perp to a long position in the perpetual position. The directional traders who hold naked long positions are the ones paying the price. On the other hand, the neutral traders who receive the funding payments from the directional traders will profit.
The entire idea of separating these two signals is to provide direction to both directional traders, who can interpret funding as a primarily favorable sentiment indicator, and to cash flow-based traders, who can position to aggregate funding cash flows regardless of the direction of the market trend.
The risks that decide whether funding capture is worth it
There is no "free" money, and the disclaimer. The main factors determining whether or not harvesting funding produces a favorable outcome on position will be as follows:
- Fund Activity - Conditions present yesterday can have opposite conditions today. A capitulated long overcrowded market can switch to negative funding and change your harvesting position from one you just gained to one in which you now owe funding. The signal you are harvesting will continually be less than stable and may also be extremely volatile, particularly for low-volume tokens that are thinly traded, such as LIT post-incentive.
- Execution and Basis Risks - Delta-neutral positions are only directly neutral while both legs are fully hedged to the intended sizes of the position. Additionally, slippage acquired during the building or unwinding of the position will affect your payment of funding received including the gap between the good's current spot price and its long-term mark-to-market price and cost for crossing the respective legs' bid/ask spreads would reduce your respective initial payments received from these funding positions. Perpetual swaps in illiquid pairings can often have a basis impact against you faster than you could earn funding.
- Liquidation and Margin Risks - Perpetual swaps are executed on a margin basis, thus if the price of your short leg of the swap moves against you before or simultaneously with the price of your long derivative leg moves in your favor your swap leg could become liquidated. Therefore, you should actively monitor the margin on the perp side.
- Tiny Edge with Multiple Intervals - Although the marginal difference between one interval and the other is trivial (ex., .01%) the overall impact of the strategy can be substantial because there is ample opportunity for both cost and operational errors to offset your pure edge on these positions. This strategy will provide you an enormous advantage purely from the perspective of very low fees & efficient pricing in relation to simply making a directional call.
How to effectively monitor this
Analyzing extraction financing is primarily a monitoring issue prior to a trading issue. To properly assess an asset's Funding sign & size, you must be able to see all three of them simultaneously, as well as how the asset's current funding compares to its recently-established baseline. An isolated funding figure does not provide much context — e.g., a funding rate of 0.01% on BTC and a very high, but thin, funding rate on an ALT are fundamentally different from one another.
The screening tool is designed to assist you with the monitoring job mentioned above. Manually monitoring funding-rate tables and price action on perpetual (or 'perp') markets across 10+ venues would not be practical; the real value of the screener is that it will help you identify unusual funding rates relative to 'normal' condition and assist you in identifying trading setups where pricing is diverging from relative price direction. If you want to learn how funding works from a theoretical perspective, please review our funding rates explainer for detailed math explanations; you may also view the funding and futures screener for live pricing and funding rates across multiple venues to identify crowded-position setups as described in the introductory paragraph above. To help evaluate whether to execute funding capture structure, the spread calculator will allow you to model both legs prior to committing capital.
Our Tools
Our Tools ArbitrageScanner consists of a suite of professional tools built upon this monitoring problem. The screener monitors pricing, spreads, and funding on 80+ exchanges, 25+ DEXs, and 40+ chains every second, as well as contains a historical spread chart allowing for backtesting of how a spread or funding/price relationship has behaved compared to either; full manual operation, with no API connection to your account ensures your money remains completely and totally your money. The arbitrage screener is the best place to begin if you're unfamiliar with how the toolkit organizes its information.
Frequently asked questions
What does it mean when funding is positive following a decrease in asset pricing?
This indicates that there are still lots of price falling longs who continue to pay shorts — basically, the long side of the perpetual futures market has more volume than short position trades. Traders continue to hold (or add to) their leveraged long positions into the falling price rather than taking a short position off of it. It indicates crowded long vs. crowded short position, rather than bullishness or a potential for market recovery; therefore, a large quantity of longs being liquidated can be expected prior to or coinciding with a recovery period.
How do I interpret the funding rate on a margin call in relation to an asset's price crash?
You need to separate the funding sign from the price sign. The funding sign tells you who is currently crowded and/or paying, while the asset price does not indicate whether or not there are any tradeable longs or short trades occurring on that asset; however, the asset's price does give you some directional indication of how long (positive sign = long) or how short (negative sign = long) the asset has become or will become. Therefore, during the margin call period, a positive funding rate may mean a crowd of longs still are accumulating downwards; conversely, a negative funding rate may indicate the crowd of margin call buyers have already flipped long to short.
What reason did the LIT funding rate maintain a positive rate during the weeks that it was down approximately 20%?
After LIT was rejected from the $1.80 rejection zone (between June 6-8, 2026), many traders continued to be long and also remain leveraged with the expectation of "bounce." As a result, most of the leveraged traders continued to hold their long positions instead of flipping to the short-end of the margin call valuations. Longs pressed demand against short demand, which left the perp priced higher than the spot price and created positive funding for the longs. Consequently, longs were required to pay shorts in spite of losing money on their positions, when the upside (less demand) was offset by the downside (increased incentive). The market volume was so small (from a $232 billion peak in December 2025 to approximately $39 billion) that it allowed this poorly-positioned market to continue.
Does positive funding always mean the price is going to go up?
Not necessarily. Positive funding only indicates that longs are crowded and willing to pay shorts. The fact that buyers are about as thickly funded as possible makes it an excellent contrarian indicator, as it means that there is very little new buying left; if price drops, it will likely force longs to liquidate and drive the price even lower. Therefore, funding measures the impact of positioning but not the direction of prices in the future.
How can a delta-neutral trader use the funding rate?
As a source of income, not as an expected future price movement predictor. Delta-neutral traders maintain a position at zero net cost by simultaneously holding amount of longs offset by the same amount of shorts, and thus collect the funding payment. When the funding rate is positive, they do not collect the funding payment; therefore, they prefer to hold the spot and short the perp to get paid when the funding is positive. Conversely, delta-neutral traders prefer to offset their delta with shorts that are short when the funding is negative. Funding will swing from positive to negative, so execution risk and liquidation risk are present for each leg, and because the amount of funding they will receive will compound very quickly over time, it is extremely important for delta-neutral traders to maintain low commission rates on the contract that they trade, and to execute their trades cleanly and at the same time.
How often is funding paid out?
This varies by exchange; many centralized exchanges settle funding payments on an 8-hour basis, while numerous newer perpetual contracts structured on DEXs settle on an hourly basis (Lighter settles the funding on an hourly basis among the longs and shorts via peer-to-peer routing). The shorter the time period, the more times that a relatively small funding payment will compound over time. This has a significant impact on any strategy that will hold a position for an extended duration.
Try ArbitrageScanner for one day free — get access to the entire crypto arbitrage tool set including live funding rates for 80+ exchanges updated every second.
This article is not intended as financial, investment or trading advice, only as information and education, and to the extent that it does provide the general data it will create a significant risk of loss, including potential loss of all funds invested, when trading cryptocurrencies, perpetual futures or using funding capture as the strategy. The data, examples (specifically the LIT example below), and any other example of market data could be different from the last time it was generated. All of this data/ examples will continue to increase in value or decrease exponentially against the market (and therefore change the historical reports); all market data and prices are volatile in nature and change on a continual basis. All market data, numbers and examples will be continuously changed over a thirty-day period after generation of our data and examples. There is no automatic ability (API) for ArbitrageScanner to access your accounts through its services, so your funds will stay within your control. Do extensive independent research before committing any capital.
Want to learn more about crypto arbitrage?
Get a subscription and access the best tool on the market for arbitrage on Spot, Futures, CEX, and DEX exchanges.

You might be interested
Thetanuts $2.1M Flash-Loan Exploit: How a Low-Supply Rounding Bug Let an Attacker Mint Tokens for Free
How to Vet a Crypto Exchange Before You Deposit: A Counterparty and Sanctions-Risk Checklist
WET's 111% Unlock: What Happens When a Token Doubles Its Float Overnight
