The Hot Dog Pattern


with ArbitrageScanner!
In the world of cryptocurrency trading, it is essential to be able to find all of the reliable signals that exist among so much market noise and thus be able to maintain activity at a consistent level of profitability. Although there are many different formation styles (e.g. "Head and Shoulders" or "Double Bottoms") that are the most widely recognized formations, one that has made its place as a valid resurgence pattern through patterns of consolidation is called "Hot Dog Patterns."
Understanding the Hot Dog Pattern Structure
The "Hot Dog" technical pattern is a three-candlestick formation that graphically resembles a “hot dog” in a bun. Hot Dogs represent temporary cones of volatility followed by a very long build-up of volume leading to a reversal of trend in price direction.
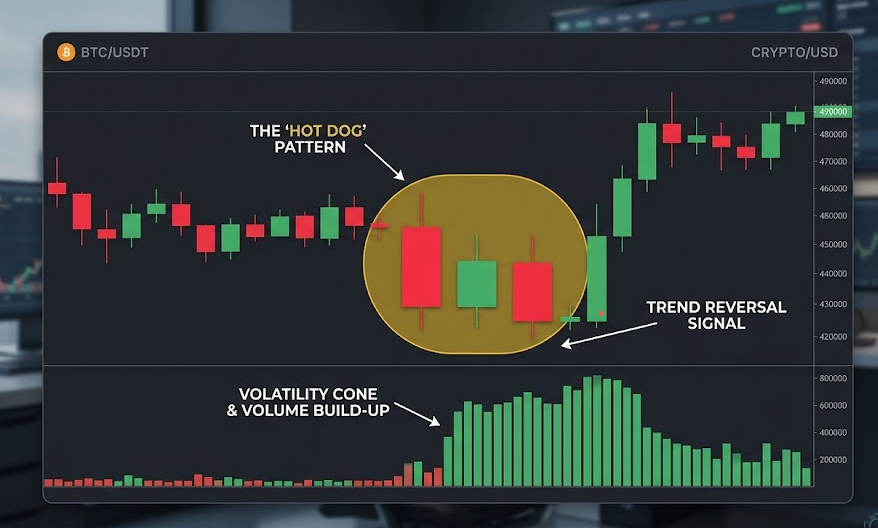
The Three Essential Components
There are three main components of a Hot Dog Pattern – the meat, a large outside candlestick on both the left and right, and a smaller middle candlestick. The two outer candlesticks are referred to as "buns" and the middle candlestick is referred to as "meat." The price action depicted by the Hot Dog Pattern shows there was indecision in the market followed by this new generative momentum.
Bullish vs. Bearish Hot Dog Patterns
The Bullish and Bearish Hot Dog Patterns are represented as follows:
-
Bullish Hot Dogs develop following an extended downward move in price, as illustrated by the middle "meat" showing signs of strength by buyers confirming that an upward trend is forthcoming.
-
Bearish Hot Dogs develop at the top of an extended upward trend, as illustrated by the middle "meat" showing signs of weakness by sellers indicating the asset is overbought.
Key Visual Characteristics to Identify
The meat is significantly smaller yet positioned between the size and volume of the two bun candlesticks that make functional Hot Dog Patterns; thus, visually distinguishing them from others. Traders gain better insight into making trading decisions by locating three candlestick formations called Hot Dog formations. Traders assess the price point of candles by verifying that the wick (shadow) of the center candle does not go above or below two outside candles.
Rules for Identifying a Valid Hot Dog Pattern
The identification of valid Hot Dog patterns derives from the three-candle formations. Valid Hot Dog patterns require several characteristics to be met to allow the trader to obtain maximum practical trading opportunity. Trained traders can suffer from false identification of patterns and can make poor trading decisions.
The three basic components to identifying a valid Hot Dog pattern include the following:
The Tightly Bound Trading Range of the Middle Candle
The middle candle of a Hot Dog pattern has the smallest trading range of the three (3) candles, indicating a micro-phase of price consolidation and a potential shift from sellers’ to buyers’ or vice versa.
Color Requirements for Each Candlestick
The color sequence must be red, then green, then green again. A valid Hot Dog pattern has one red, one small, and one strong green in terms of bullish conditions. To consider a bearish Hot Dog, look for a bearish engulfing candle or a strong red candle as the third element of the top.
Context and Location on the Chart
The development of the Hot Dog pattern would normally occur at established support and resistance levels. The Hot Dog pattern would be a reliable reversal pattern when it occurs at the conclusion of a well-defined up and/or down trend.
The Psychology Behind the Hot Dog Pattern
Understanding the psychology of the market is crucial to trading success. The Hot Dog patterns provide a visual representation of the dynamics of a tug-of-war between the buyer and seller. Neither the buyer nor seller has firm control of the marketplace and will produce a trading range established by fatigue.
Market Sentiment During Consolidation
Sentiment for the Hot Dog Pattern - Overall Investor Sentiment. The emergence of the middle candle of the Hot Dog pattern represents a peak of nervousness concerning the investment sentiment. Traders will use this pause to determine if enough liquidity exists to carry the trend or if they want to hedge / cover their positions.
Why the Pattern Signals Potential Reversals
If the third candle breaks out of the previous 2 candle range, this implies that one of the two sides has won the battle. Thus, as others that were late rush into the new direction they will provide additional volume to the market creating new trading opportunities.
Volume Considerations in Pattern Validation
The Volume Implication for Validating the Pattern: for a true Hot Dog Pattern, you would expect to see volume increase on the third candle in order to signal that the resultant price movement is supported by genuine buying demand and/or selling pressure, thereby reducing the possibility of a fakeout trade.
Trading Strategy for the Hot Dog Pattern
To successfully trade this asset you will need a disciplined trading strategy which would include timing of when to enter and exit trades.
Entry Points for Bullish and Bearish Patterns
The Entry Point for the Long and Short Patterns: For a bullish pattern your entry point is determined at the third candle high, once BTC price prints above this level it is time to enter long or short the trade accordingly. Conversely, if trading from a short pattern your entry would be measured as just below the third candle low.
Setting Appropriate Stop-Loss Levels
Setting Stop-Losses: Because risk management is of utmost importance, your stop-loss order should be placed just below the middle candle (for long positions) in order to protect the position in the event the pattern is invalidated.
Determining Profit Targets
Setting Your Profit Targets: Traders will typically employ a 1:2 risk to reward ratio when calculating profit targets. Above all, look to the major moving averages or significant historical price-support levels to maximize your profit potential.
Real-World Examples in Bitcoin Markets
In reviewing the history of BTC, the Hot Dog Pattern is often associated with upward surges that occur after a prolonged time of larger sideways price activity. This pattern is evident on the crypto charts, especially on the 4hr or Daily timeframes.
Pattern Performance in Different Timeframes
Analysis of the Hot Dog Pattern on Various Timeframes: Although cryptocurrencies can be very volatile, the Hot Dog Pattern tends to be more stable, and therefore more reliable, on longer timeframes (Daily/Weekly) in comparison to scalping timeframes, where price fluctuations are often not very consistent.
Combining the Hot Dog Pattern with Other Indicators
No indicator should ever be used in isolation. Traders can use a combination of the Hot Dog Pattern with an oscillator (e.g. RSI) to identify potential reversals when price action is overbought or oversold.
Common Mistakes When Trading the Hot Dog Pattern
- Ignoring the Larger Market Context – Trading a bullish Hot Dog pattern in a global crypto crash.
- Incorrect Position Sizing (Risking too much on a single trade).
- Prematurely Entering (Entering before the third candle closes).
Advanced Hot Dog Pattern Techniques
Professional traders should conduct a multi-timeframe analysis. When trading a 15-minute Hot Dog Pattern, you should look to see if the 4-hour Hot Dog pattern confirms the bullish trend; if it does, you have a greater chance of succeeding.
Building a Complete Trading Plan
Putting Together a Complete Trading Plan: Make sure to include the Hot Dog pattern in your social trading journal. Backtesting and optimization of results indicate that combining this with blockchain technology, such as the exchange net flow data, can provide accurate forecasts of the future price action.
The Bottom Line
The Hot Dog Pattern is an excellent tool for all cryptocurrency traders. By understanding the construction and risk management of the Hot Dog, traders can make better-informed trading decisions in the crypto markets. Keep in mind that past performance is not necessarily an indication of future performance.
Disclaimers: The information in this article is for educational purposes and is not intended to be financial advice. There is always an inherent risk with investing, so always manage your risks properly. It is best to use a non-custodial wallet to keep full control of your funds.
FAQs
How does the Hot Dog Pattern perform in large cryptocurrencies like BTC vs small cap Altcoins?
The Hot Dog Pattern typically performs better on BTC and ETH due to the higher liquidity of those two coins. Smaller cap altcoins may show whipsaws in price movement and produce false signals.
How long does it typically take before a Hot Dog Pattern breaks out after it has completed?
In the cryptocurrency markets, breakout will typically occur within 1-3 candles after the Hot Dog has completed.
Are there any specific market conditions where the Hot Dog Pattern is most productive?
Yes, the Hot Dog Pattern is usually at its most effective at the end of either an obvious bearish or bullish trend and especially when prices are near long-term support or resistance.
How do you distinguish between a real Hot Dog and false Hot Dog signals?
The best way to eliminate false Hot Dog signals is to confirm with volume and/or by waiting for the close of the third candle in the pattern.
What is the overall success rate of a Hot Dog Pattern?
There are varying degrees of success depending on historical data; however, backtesting and trading in combination with other technical analysis tools, such as moving averages, indicate a 60-65% success rate for the Hot Dog Pattern.
Want to learn more about crypto arbitrage?
Get a subscription and access the best tool on the market for arbitrage on Spot, Futures, CEX, and DEX exchanges.

You might be interested

Essential Stop Loss Features for Cryptocurrency Trading
NFT vs. Cryptocurrency

Money Flow Index in Cryptocurrency Trading
