Money Flow Index in Cryptocurrency Trading


with ArbitrageScanner!
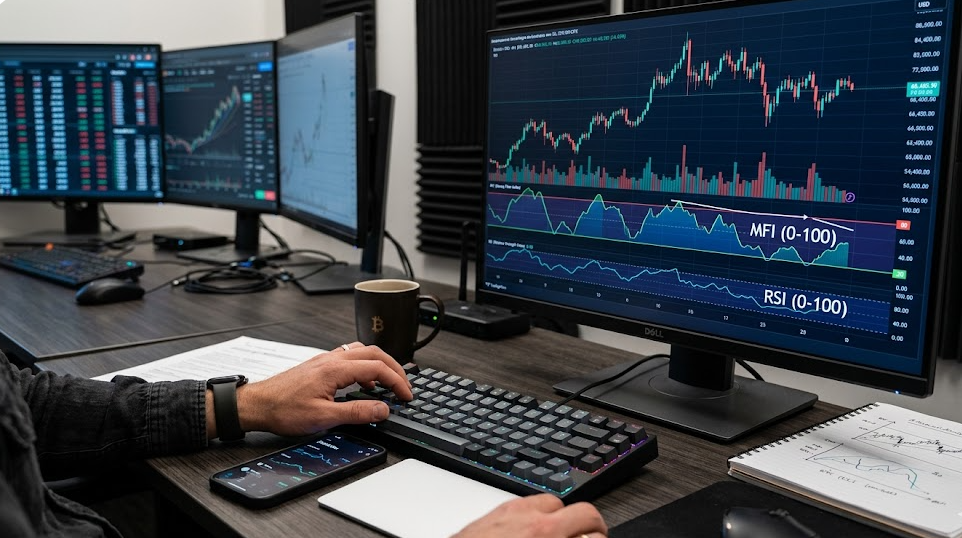
The Money Flow Index (MFI) is a useful tool that works in conjunction with other types of analysis to identify whether dollars that are flowing into and out of a cryptocurrency have shown an increasing or decreasing state of strength over time using price and volume for the basis of determining the intensity of money moving into and out of the assets. While the MFI is used for measuring volume-weighted RSI, the MFI is a more complete and detailed picture of the movement of money into and out of the crypto market because of the volume component in the calculation of the MFI, as compared to price-only oscillators, giving traders a better view than by just looking at price alone. This use of volume also supports the thesis of the volatility of cryptos that price comes after the amount of price movement follows volume trends, which are often preceded by volume spikes, therefore, understanding how to use the money flow index (MFI) is critical in determining reversal points in the crypto market, as well as confirming existing trends.
What MFI Is/How it Works
At its core, the MFI is defined as a momentum oscillator that ranges from 0 to 100. The MFI differs from the Relative Strength Index (RSI) because while both indices use price data to calculate momentum for an asset, the MFI incorporates volume to determine the pressure applied to the price as a result of buying or selling.
How It Works on a Basic Level
The MFI is based on the assumption that volume will always be a leading indicator of price-action; therefore, when the MFI is rising, it shows that "smart" investors are accumulating the asset; conversely, when the MFI is declining, it shows that an asset is being distributed or the capital is leaving the crypto market.
Historically, the MFI has provided traders with a reliable way to filter out "fakeouts" in the market, given that in addition to price, the MFI measures volume.
Calculation methodology
The following steps are followed in order to find the money flow index:
- The typical price is calculated using the formula: The typical price is (high + low + close) / 3
- The raw money flow is calculated using the following formula: Raw money flow is typical price x volume
- In order to calculate the money flow ratio, we follow this formula: Money Flow Ratio = (14 period positive money flow) / (14 period negative money flow)
- Using the previously calculated money flow ratio we will then use the following formula in order to find the MFI: MFI = 100 - [100 / (1 + Money Flow Ratio)]
If the current typical price is higher than the old one I will have a positive raw money flow otherwise I will have a negative raw money flow.
Range Interpretation
The MFI oscillator is most often set at 14 periods. If the MFI reads above 80 the asset is typically overbought, whereas if it reads below 20, the asset is typically considered oversold. Many traders use 90/10 bands in the cryptocurrency market to account for the extreme volatility of many of the coins they are trading.
Applications & Signal Generation
The MFI is used mainly to identify possible reversals and confirm current trends in the market. Using historical volumes along with price action provides insight into how price and volume interact with each other.
Overbought/Oversold
When the MFI goes above 80 then the market is potentially reaching a point of exhaustion; therefore, price is likely to retrace a little bit. If the MFI is less than 20, the asset is likely to bounce back up; however, if the current trend is strong enough, it can remain in these two areas for long periods of time, so it is important to wait for the MFI to cross back into the neutral area prior to executing any trades.
Divergence Analysis: The Strongest Signal
Divergence means that price and an indicator give conflicting signals.
For instance:
- Bearish Divergence: price sets a new high, however MFI sets a lower high; indicating the upward move is weak and likely to reverse.
- Bullish Divergence: price sets a new low, however MFI sets a higher low; indicating that selling pressure has started to weaken.
MFI vs. RSI Analysis: How Each Indicator is Utilized
Both are momentum indicators, however MFI and RSI have two different objectives when performing technical analysis. The RSI is simply focused on analyzing the rate of price movement and the changes in that rate of price movement. The MFI incorporates volume providing a better perspective on the health of a market.
Since the MFI is a significant indicator, it works well with all assets within stock and crypto markets, showing whether or not there is enough capital behind a price move. Price rising on low volume can cause RSI to display strong momentum, whereas MFI is low and indicates a weak trend.
The MFI is better at measuring the flow of money entering into an asset.
Pragmatic Application & Risk Management
To proficiently apply the MFI, you want the MFI to be utilized alongside other indicators on your TradingView chart. A successful indicator strategy will have more than just watching for the 0 and 100 levels.
- Trade Execution: You will enter a long position when you observe a positive divergence with a rising MFI, indicating a trend, which occurs when MFI is in the area below 20 (between 0 and 20).
- Position Sizing: You will determine the currency pair's volatility and select your position size so that false readings will not result in a total loss of your account.
- Exit Strategies: A decline in the MFI from areas of high value (greater than 80) indicates when it is time to exit the trade. Once this happens, you should move your stop loss close to your position to maximize your potential profit.
Money Flow Index Limitations
The Money Flow Index (MFI), like all indicators, can provide false signals, particularly in ranging (fluctuating) markets where volume is inconsistent. The MFI is also a lagging momentum indicator and should be used with caution when predicting sudden changes in cryptocurrency markets due to limited historical data.
Combining other technical indicators with your MFI will reduce your risk exposure. Examples would be using price action (candlestick formations), moving averages, and support/resistance areas to assist you in deciding on trade entries/exits. Do not base your trade decisions solely on the MFI; always consider using more than one type of indicator that combines data from multiple sources.
Conclusion
A serious cryptocurrency trader should have access to the Money Flow Index (MFI) as a trading tool. As MFI utilizes price and volume analysis, it provides a comprehensive analysis of buying/selling pressure that price oscillators cannot provide. Therefore, the MFI can be used to assess whether an asset is overbought/oversold or provide good divergence trading opportunities and assist with providing clarity on the complex world of cryptocurrency money flow.
FAQs
What reliable signals can I get from the MFI?
Reliable MFI signals are found by looking for divergences between price and MFI. For example, if there is a new high in the price of an asset and a lower high in the MFI, a divergence exists between the MFI and the asset price. You should also look for breaks in market structure to support your decision to enter/exit your trade.
What MFI settings are the best for cryptocurrency?
Generally, the MFI is typically set to 14 days for calculations. However, for day trading at lower timeframes, you should adjust the MFI to 9 days to capture shorter-term price movements.
How can I utilize the MFI with other technical tools?
MFI is best used in combination with other trend-following indicators like Exponential Moving Averages or MACD. MFI depicts trends, whereas EMA shows price direction.
When will the MFI provide accurate signals in the cryptocurrency markets?
The MFI is most accurate during periods of trend and at points near the extremes (highs/lows) of major reversals (i.e., shooting stars, hammers, etc.). The MFI can also confirm an end to a trend when the volume begins to diverge from price.
What's the best way to deal with false MFI signals?
If the MFI reads overbought or oversold, these readings can give you an alert, but you should always confirm with other signals before entering into a trade.
Want to learn more about crypto arbitrage?
Get a subscription and access the best tool on the market for arbitrage on Spot, Futures, CEX, and DEX exchanges.

You might be interested
Binance Leverage Trading

Morning Star Pattern

Inside Bar Trading Strategy for Cryptocurrency Markets
