RSI Divergence in Cryptocurrency Trading


with ArbitrageScanner!
Timing is of the utmost importance when dealing with the fluctuating cryptocurrency market. While many investors may only consider the price movement of a currency; professional participants in the marketplace will look deeper into the drives behind that price action. One of the more powerful tools available to traders when analyzing price movement is the RSI Divergence indicator. RSI Divergence can be used as a leading indicator predicting changes in price before they happen, which means that whether you are looking at the fluctuating peak-and-valley movements in Bitcoin or trying to find entry points in Altcoins, understanding how RSI relates to price action will make you a better decision-maker when trading.
Price Divergence In The Crypto Market
What Is Divergence And Why It’s Important
When talking about divergence trading, "Divergence" refers to a mismatch or a discrepancy between the price chart and technical indicators. In most cases, the price and the momentum indicator for an asset will always be correlated to one another. However, when the price of an asset creates a new high or low that has not been confirmed by the associated technical indicator, we see a divergence. This means that the underlying bullish momentum or bearish pressure of an asset is weakening, even though the current price for that asset still appears to be moving in the same direction.
How Price Action Works With Technical Indicators
The RSI is a momentum indicator that helps measure the rate of change of price movements from one price point to another; it will oscillate between zero and 100. In a healthy bullish market, an increase in price will be accompanied by an increase in RSI. However, if an increase in price has created a new high while the RSI has formed a lower peak; this indicates that the bullish trend is losing strength.
Early Warning of Future Trend Changes with Divergence
A divergence indicator can be used by traders as an early warning system. Divergence signals that although the price may not turn immediately, it indicates to traders that the current trend direction has started to lose momentum. Additionally, because of the complexity of the dynamics of the cryptocurrency markets and the FOMO (Fear of Missing Out) factor driving prices to extreme levels creating extreme valuations of these assets. When there are divergences (price versus indicator), then smart money has either begun to exit or enter the market substantially increasing the chances of price reversal.
Identification of Bullish Divergence Indicator
Why are Bullish Divergences Important for Traders?
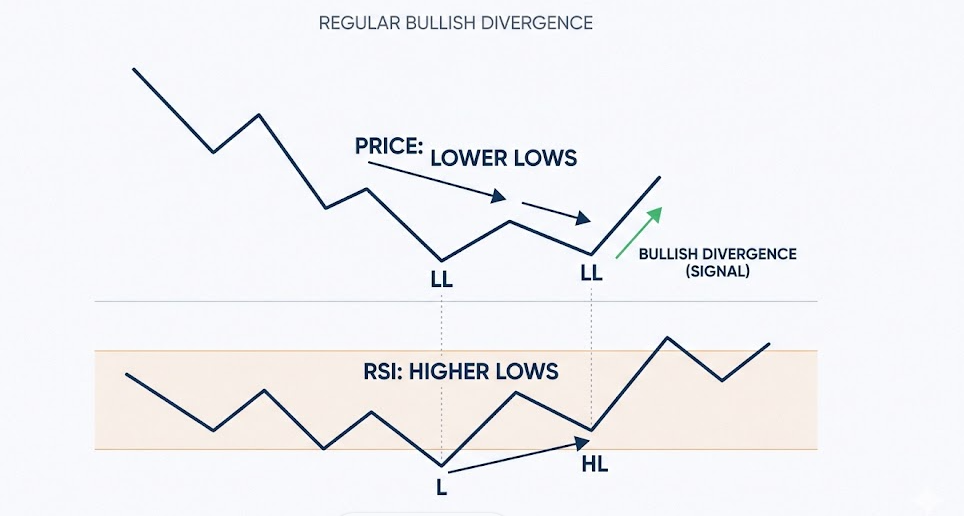
The classic identification of a bullish divergence occurs when prices are making lower lows, while the indicator is making higher lows both in price and in value. A bullish divergence gives traders confidence to know that there is no increase in selling pressure even though the price has been declining. This divergence will appear on the price charts as prices recover to establish new support levels, while the RSI begins to rise, which is a bullish reversal signal.
The bullish divergence pattern provides evidence of a change in market sentiment or attitudes toward the underlying asset. In most cases, although the general public may be reacting to fear as a result of the continued decline of prices to lower lows, smart or professional traders will have been watching the indicators to assess the rate of increase in sales volume is declining. This "siphoning" off of sales pressure will typically lead to a sharp upward price movement and is a strong indicator of a trend reversal for traders.
Real World Bullish Divergences Using Bitcoin
There have been many classic bullish divergences on Bitcoin charts over the past several days at the end of some major corrections to the price of Bitcoin. An example of this is that at the Summer 2021 local bottoms, the Bitcoin price was falling to new lows while RSI showed an upward slope, indicating to traders looking for bullish trading setups a probable opportunity to jump into Bitcoin and ride it to a new price level of $69,000.
Entry and Exit Strategies for Bullish Divergences
When traders see Bullish Divergence, they often wait for a “trigger” before taking action; usually something like an invalidation of the bearish engulfing candlestick or the RSI crossing over 30 again. Those that trade based on this divergence typically place their stop loss slightly below the most recent price low and target the next major resistance level.
Bearish RSI Divergence: Recognizing Signals to Reverse
Characteristics of Bearish Divergence
The classic example of Bearish Divergence is opposite that of Bearish Exhaustion; which would be Bullish Exhaustion. Bearish Divergence is formed when the price creates a new extreme high, which is higher than the last extreme high but the successive extreme highs on the indicator are lower than the last extreme highs. Therefore, bulls are not being supported by sufficient momentum.
Real Life Examples of Bitcoin Bearish Divergence
Bearish Divergence is generally formed in crypto just prior to the end of bubble like price increases. Price moves to extreme highs and the RSI fails to reach the same extreme level increases the likelihood of a crash in price. Price is created by the buying of low volume retail traders as the price has increased, while there are many institutional traders who are likely to be selling their holdings prior to a crash.
Bitcoin Bull Runs in 2017 and 2021: Divergence Analysis
At the end of both the 2017 and 2021 Bull Runs, there were several instances of significant Bearish Divergence on the price chart for Bitcoin. When viewing BTC on the weekly timeframe, the price reached an all-time high, but its MACD/RSI were showing that it was much weaker than what was previously seen in other time periods. This divergence indicated to us that the macro trend had reached a top and that a lot of traders would lose money if they were trading off this bearish momentum shift without proper risk management techniques.
Risk Management Strategies for Bearish Divergence
Bearish divergence can go on for quite some time in a "moon mission style" (i.e., massive moves) so do not make trading decisions based solely on divergence. Always use trailing stop-losses along with looking for confirmations of the bearish trend such as moving average breaks and support "sheets" to protect your capital.
Hidden Divergence: Trend Continuation Signals
Bullish hidden divergence occurs when a price makes a lower low while an indicator forms a higher low (i.e., Pullback) while in an uptrend. The asset is "recharging" its momentum to further the bullish trend. Bullish hidden divergences are one of the best trading signals for swing traders.
Bearish Hidden Divergence Formed at the Top of a Trend
Bearish hidden divergence occurs when a price makes a higher high while an indicator creates a lower high (i.e., Recovery) while in a downtrend. Even after experiencing price jumps, currently, there is a high probability of further price declines (downtrend) in the near future given how far they have rallied recently based on the current state of momentum indicators.
When making investment decisions on hidden divergences, most strategies recommend that investors purchase an asset after it has declined in value. If an investor has established a position via hidden bullish divergence, it is basically a "cheat code" to capitalize on purchasing assets in a trend that's supposed to have already ended.
Investors can also use a divergence cheat sheet to assist new investors in identifying hidden bullish and bearish continuations.
Timeframe Considerations for RSI Divergence
Depending on their trading timeframe, RSI divergence signals may be less reliable than those based on other analysis methods. For example, low time frame charts (e.g. one minute or five minutes) generate a lot of noise relative to RSI divergence compared with high time frame charts; therefore, because of the risk associated with using these low time frame charts, high time frame charts are a more viable path to follow when trading based on RSI divergence.
Generally, the following timeframes work well for different types of trading strategies:
- Daily and Weekly – ideal for long-term position trades and macro trend transitions.
- 4 hours and 1 hour – best for swing traders; and daily tops / bottoms are the most ideal timeframes to locate both local highs / lows.
- 15-Minute and below – appropriate for scalp trading but have a tendency to generate many false signals.
When day trading based on short-term divergences, traders should focus on timeframes less than 15 minutes in conjunction with other technical indicators because of the potential to generate a significant number of false signals due to small day-to-day price movements in cryptocurrency.
Medium-Term Divergence for Swing Trading
Traders benefit in particular from 4-hour RSI divergence as they are able to capture multi-day price increases following the occurrence of a bullish RSI regular divergence.
Long-Term Investment Signaling from Higher Timeframe Charts
Long-term investors have an opportunity to buy the dip with Bitcoin when there is a bullish divergence in price on the weekly chart. Bullish divergences on weekly charts have provided investors with great long-term investments throughout history, as they have been extremely rare and predictive when crypto winters end.
Combining Indicators with RSI Divergence
Confirmation of Support and Resistance Levels
An RSI divergence has more power when it happens directly at a major horizontal support or resistance level. While you may be very early based on the divergence itself, the presence of a support level gives you a "floor" for your entry validation.
Moving Average Support and Resistance
The moving average convergence divergence (MACD) indicator is commonly used by traders in conjunction with the RSI. With both indicators, the occurrence of divergence leads to a higher success rate due to double divergence (RSI or MACD). You could also utilize the 200-period moving average with your RSI to validate that you're not trading against the overall trend.
Volume Validation for Divergence
Observe if there is a "volume climax" when the price finds its final high or low. If the volume has been decreasing during the period of divergence, it validates that market participants are no longer interested in continuing to move the current price further.
Confluence-Based Trading
You'll want to avoid trading in a vacuum. A solid divergence trading plan uses the RSI as the lead indicator and requires confirmation via the MACD or reversal patterns to validate an entry. This approach can help reduce your chance of getting caught in 'fake-outs' (or being led out of position by the market).
Limiting Factors and Common Errors
Divergence and false divergence signals can signal a potential price movement; however, they are not a guarantee of that price movement. When the market is trending strong, it is possible for a cryptocurrency to be making higher and higher new highs and for the RSI to remain in a bearish divergence state for weeks. Because of this, many traders lose money trying to "short the top" due to false divergence signals.
Market Conditions Where Divergence is Not As Reliable
During an event like the "black swan" events in the market, or when the news induces a large amount of volatility; the rules for technical indicators can break down. During times like this, price movement is determined more by liquidation cascades and panic than by the usual way that price moves, making divergence signals less valuable until the market stabilizes again.
Risks of Over-Reliance on One Technical Indicator
Using RSI divergence signals only is a high-risk strategy; you should always combine your technical analysis with fundamental factors such as network upgrades or regulatory developments, or if an ETF is flowing into the market. These things could override the divergence signal.
Technical framework for RSI divergence trading
Step-by-Step Divergence Signal Identifying Process
- Identify current trend (Bullish/Bearish).
- Find price making a new peak (High/Low).
- Observe if the RSI has made a corresponding peak.
- If NO: Determine if the divergence is a regular or hidden divergence.
- Wait for a candlestick confirmation (e.g., a bullish pin bar).
Establishing Proper Alerts and Scans
Alerts for RSI divergence on a modern trading platform will allow the trader to not monitor a price chart all day, as well as to only place trades when a high probability signal exists for the divergence indicator used.
Position Sizing Based on Strength of Divergence Signals
Not every signal is the same. For example, a bullish divergence with the price at a multi-year low warrants a much larger position size than a minor divergence occurring on the same day. Implementing risk management will allow the trader to continue trading after the failure of a signal.
Mastering RSI Divergence
Learning to master RSI divergence is similar to being able to read the pulse of a market. It will provide you with insight into levels of exhaustion behind price movements, as well as a roadmap of potential reversal points. You will be able to take the RSI from simply an oscillator to a sophisticated trading strategy when combined with proper risk management and other technical indicators, such as the MACD. The goal should not be to capture every price move but rather to look for the highest probability setups where both the bulls and bears have reached a breaking point.
FAQs
How reliable are RSI divergence signals compared to RSI divergence signals in traditional markets?
RSI divergence signals are very reliable in the cryptocurrency space due to momentum-driven and retail-oriented psychology. However, there is more market "noise" in cryptocurrency, so that divergence is present for a longer time period before reversal as compared to stocks or forex.
What is the success rate for historical regular divergence RSI patterns to predict price reversals of Bitcoin?
Although no indicator is 100% accurate, using a regular divergence from the daily chart has historically produced 60% to 70% successful RSI divergence signals when volume and support/resistance were also monitored. The percentage of success on smaller timeframes is considerably lower.
How should traders modify their analysis of divergence during extremely volatile market conditions?
In periods of extreme volatility, traders should increase the RSI setting (for example, from 14 to 21) so that RSI signals will be smoothed out or wait for confirmation on a larger timeframe. In general, it would be safer to avoid trades using technical signals during high-impact news announcements until the price action has had a chance to settle down from its volatility.
What are the best RSI settings for determining reliable cryptocurrency divergence?
The standard 14-day RSI trade has been well accepted in the financial markets and most other traders (and trading bots) are using this setting. For daily chart swings the more successful swing traders prefer to use a 9-day RSI due to its increased sensitivity.
What cryptocurrency has provided the most reliable RSI divergence patterns?
Both Bitcoin and Ethereum are highly liquid assets and provide the most reliable RSI divergence signals. Small cap altcoins tend to be manipulated and therefore the patterns of these divergence signals may create "false" divergence signals as compared to other markets.
Want to learn more about crypto arbitrage?
Get a subscription and access the best tool on the market for arbitrage on Spot, Futures, CEX, and DEX exchanges.

You might be interested

Grid Trading in Cryptocurrency
Dollar Cost Averaging (DCA)

Crypto Arbitrage Trading
