SMT Divergence


with ArbitrageScanner!
The ultimate advantage in trading on higher than normal trading volumes would be the ability to anticipate and react to the actions of the `Smart Money`. Retail customers and the average trader use lagging indicators to provide them with signals. Smart Money professional / institutional traders look for cracks in the correlation of different markets. This is where the concept of `SMT Divergence` comes into play as part of the ICT (Inner Circle Trader) trading methodology. Essentially, SMT Divergence is a leading indicator to determine where an institution is accumulating or distributing positions, frequently on the edge of a significant market trend change.
Understanding Divergence in Technical Analysis
At the heart of Technical Analysis, `Divergence` is defined as a condition that occurs when the price of any asset diverges from the way that other asset's price is behaving (i.e., the price of Gold vs. the price of the USD). In other words, the divergence signals that the existing trend is losing momentum and a change in direction is (likely) imminent. In traditional technical analysis, traders generally use price and oscillator divergences (i.e., RSI) as a means to make trading decisions.
Regular vs. Hidden Divergence Explained
Regular divergences are used primarily to identify potential trend reversals. A bullish divergence occurs when the price has made a new low and the indicator has made a higher low. In contrast, a hidden divergence is a sign that the existing trend is continuing. Understanding the psychological differences between regular and hidden divergences is important because it provides insight into the potential exhaustion of either buyers or sellers in relation to the current state of the market.
The Psychology Behind Divergence Patterns
The concept of divergence goes well beyond a collection of points (or lines) on a chart; it represents a change in the psychology of those who are currently trading in the marketplace. When market divergence happens, prices are at new highs or lows but the buying or selling activity that created the new price has begun to diminish. Retail traders who are trying to get in on the ‘tail end’ of a price move do not have any buyers left when the price move is happening and as institutional or ‘smart money’ traders start to take profits by selling. This represents the potential for a future market reversal.
Momentum Shift Indicators in Price Action
To identify when a potential momentum shift is occurring, traders can utilize price action with either the moving average convergence divergence (MACD) or relative strength index (RSI). These two types of tools measure how fast a price is moving—momentum. When momentum starts to slow in an uptrend or downtrend with no change in the price, momentum is greatly diminishing and the trend's ‘engine’ is no longer moving forward at full capacity.
The Fundamentals of Smart Money Tracking
The Smart Money Technique divergence is unique in that it looks at two inter-correlated assets vs. one asset and an oscillator (like MACD/RSI). Its purpose is to use inter-market analysis as a tool to verify institutional sponsorship of an asset.
Identifying Institutional Investor Behavior
Institutions—banks, hedge funds and central banks—trade in such large volumes that they cannot buy or sell an asset in one price transaction without significantly increasing the price. Therefore, institutions have created an approach to building their positions over time. Additionally, smart money activity becomes visible when one asset has not followed the price move of its correlated peer (due to that peer being either held up (too high) or pushed down (too low) by institutional orders).
Theoretical Foundations of Smart Money Analysis
The Smart Money Technique theory states that assets that are positively correlated (for example, the NQ and ES) should flow together (move in the same direction). If they do not, then a ‘crack in correlation’ will occur. The divergence in the data series produced by the development of an asset is known as a Smart Money Divergence, or SMT Divergence for short. This type of divergence shows that there are smart money trades taking place behind the scenes, providing opportunities in the market for people able to identify the footprint of these trades.
Key Indicators That Reveal Smart Money Activity
The RSI is useful as an indicator to assist in finding SMT divergences; however the primary “indicator” of SMT Divergences are the price action of another related asset. An example of how traders use price action to find SMT Divergences can be seen in the currency markets, where there are two major currency pairs that are regularly compared, namely EUR/USD and GBP/USD. According to Smart Money Theory, when either of these currency pairs make a lower low (LLL) compared to its correlated currency pair, at the same time as the other currency pair makes a higher high (HH), this generates SMT Divergence, as one asset is refusing to follow its counterpart, hence indicating that Institutional Money is involved to cause price action to vary.
The Edge of Following Institutional Money Flow
By obtaining an SMT Divergence you are not guessing where the bottom will be, you are confirming that the 'institutional money traders' ('the big boys') are already active in the market. These Smarter Money Indicators can assist you when determining if you are in a Bull Trap or Bear Trap, as you can ensure the price movement you are witnessing has been caused by genuine institutional activity.
Step-by-Step Guide to Identifying SMT Divergence
To successfully trade SMT Divergences, you will need to develop a precise and systematic manner of analysing your charts and how they are displayed on the screen.
Essential Tools and Platforms for Divergence Analysis
The TradingView platform is an excellent option as it can overlay multiple price lines of two assets in a one viewing window thus assisting you in comprehending SMT Divergences as they are developing in real-time. You'll want to keep track of EUR/USD in correlation with DXY (US Dollar Index) or NQ (Nasdaq) in correlation to the ES (S&P 500).
Chart Setup and Configuration
- Find your main trading asset (example; EUR/USD).
- Add a 'Comparison' symbol (example; GBP/USD or US-Dollar Index). You should use the timeframe that fits your strategy, with the 15-minute and 1-hour being the most commonly used for intraday trading strategies.
Trend Identification Techniques
Determine the overall market structure and identify a significant price level at which the market will reach either a major liquidity level or a daily order block before looking for SMT. A divergence from the uptrend or downtrend will only create meaningful SMT when it occurs at a significant price level.
Spotting Price-Indicator Discrepancies
The "Crack" will identify price-action discrepancies. The formation of a higher high of an asset (Asset A) and the creation of a lower high of the correlated asset (Asset B) is a bearish SMT divergence; thus, Asset A is a "fake" move and a probable reversal is imminent.
Confirmation Methods for Divergence Signals
Do not utilize SMT in isolation. Wait for an MSS to develop on a lower timeframe to confirm SMT divergence signals. The strongest divergence signals occur when a rejection from a supply/demand zone has occurred and confirms involvement of smart money.
Applying SMT Divergence in Cryptocurrency Markets
Due to the very high correlation of crypto markets, SMT divergence is an excellent method for cryptocurrency.
Unique Characteristics of Crypto Divergence
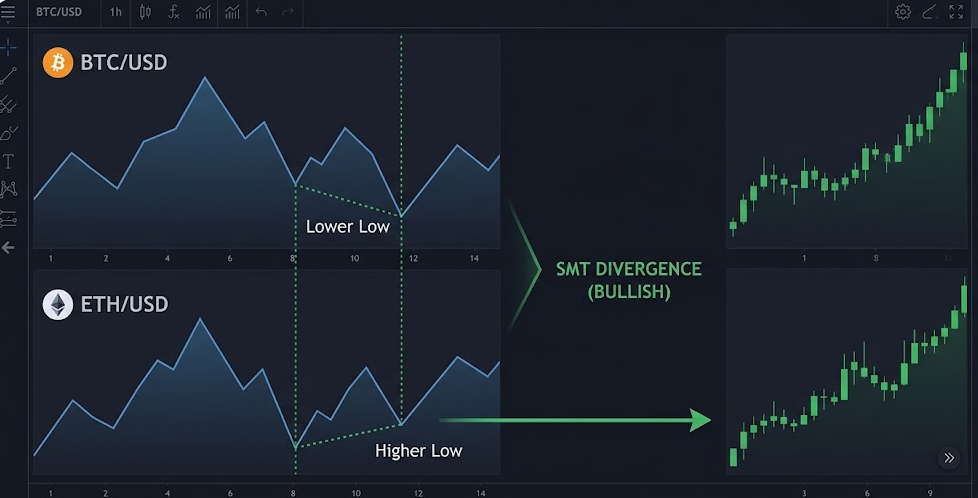
Unique to cryptocurrencies, typically one of the pairs (the leading pair typically being BTC) leads the overall market. A bullish SMT divergence occurs when BTC prints a lower low while ETH has printed a higher low. This demonstrates that ETH is a relatively strong asset and investors are buying up altcoins while BTC creates its final "shakeout" low.
Volume Analysis in Digital Asset Trading
In digital asset trading, when volume presents itself, it usually confirms SMT. When the divergence suggests a reversal of price, if it coincides with an increase in volume on the proposition that the asset will move higher, your chances for a profitable trade go up.
Institutional Activity in Major Cryptocurrencies
As there has been an increase of Spot ETFs, the amount of institutional activity in BTC and ETH has also become more structured. Therefore, using SMT divergence in your trading will help to identify the rebalancing of portfolios from large funds between the major assets.
SMT Divergence in Traditional Financial Markets
Inter-market correlation is a basic law of stocks and currency exchange rates.
Stock Market Applications and Examples
A common method that traders use is to monitor for divergence between price and momentum across the different indices. For example, if the S&P 500 is posting a lower low while the Nasdaq is posting a higher low, this is a classic bullish SMT divergence and indicates that the tech-heavy Nasdaq is leading the way back.
Forex Market Divergence Strategies
The Forex market works off of a negative correlation between the DXY Index and the other major pairs. Bullish SMT divergence occurs when the EUR/USD pair prints a higher high while the DXY fails to print a lower low. Since these two pairs should move in the opposite direction, the DXY's "failure" to move suggests the potential for a trap in the EUR/USD pair.
Commodities Trading with Smart Money Signals
Gold and silver have a strong positive correlation. An SMT divergence prints a signal to execute a trade when the price of gold breaks through a previous high but silver fails to do so. The bearish divergence near resistance creates a high probability signal for a successful short trade.
Building a Comprehensive SMT Divergence Strategy
To be successful in trading SMT, it is critical to have a plan for both entry and exit to achieve your desired outcome.
Entry Timing Based on Divergence Signals
When entering a trade, you may use divergence signals as guideposts. However, the best time to enter may not simply be when a divergence occurs. Rather, wait for the asset with relative strength to break its local market structure before entering the trade. By waiting for this confirmation of strength, you will reduce the risk of being trapped in a prolonged consolidation phase.
Strategic Stop Loss Placement
Your stop loss placement should reflect the market's future direction (in the case of a bullish setup, place your stop below the low created by the candle with the SMT). This will represent the point where institutional buying occurred most heavily and therefore provide you with a good reference point.
Profit Target Determination Methods
If you have already identified a bullish SMT divergence and have entered the trade, you can use previous HHs (Sell Side Liquidity) and/or the prior resistance level to help determine your profit objectives.
Position Sizing and Risk Management
One of the most effective ways to protect yourself from losses (regardless if you have an SMT setup) is to limit your risk to a maximum of 1-2% per trade. In employing the proper position sizing strategy using volatility, you can adjust your position size using the relevant level of volatility associated with each currency pair and/or asset you are trading.
Advanced SMT Divergence Techniques
Traders who are seeking to improve their accuracy when trading SMT can use longer timeframes to help refine their SMT entries and exits.
Multi-Timeframe Divergence Analysis
Traders can evaluate divergence at multiple timeframes to identify whether the trade they plan to execute on the 15-minute chart has a high probability of success by evaluating the overall market direction or trend on the 4-hour chart. By looking for lower time frames within an SMT zone on the higher time frame, you will be able to identify potential market shifts.
Combining Multiple Technical Indicators
Use of Multiple Technical Indicators While ICT trading is price-aligned, use of an RSI indicator may also be beneficial. When you find either an SMT divergence (inter-market) as well as a standard RSI divergence (intra-market), this is a confluence of signals that is very hard to ignore.
Anticipating False Signals and Traps
False Signals and Traps There may be cases where an asset may move opposite of each other due in part to high impact news releases. It is very wise to check an economic calendar for news releases to help determine if your setup is indeed "genuine". True Smart Money Technique divergence occurs during "clean" days, NOT just during episodic volatility spikes.
Conclusion
SMT divergence is more than just a trade opportunity; it serves as a lens to view the market's true mechanics. By understanding that two positively inter-correlated assets must move in unison with each other, you can identify when they will not; this is where the Smart Money leaves their mark(s). Having an understanding of SMT divergence in your trading plan will assist you in trading with, and not against, the largest global financial institutions.
FAQs
What is the difference between SMT Divergence and Conventional Divergence Software?
Conventional Divergence is when an asset and an indicator (i.e. RSI) are compared against one another, while SMT (Smart Money Technique) is when two highly correlated assets are compared against each other to identify a divergence of institutional sponsorship.
What are the best indicators for tracking Smart Money in crypto?
The best "indicator" to track the Smart Money in crypto is the price action of Bitcoin versus Ethereum. When correlation between the two assets starts to break at significant support or resistance levels, this indicates a high likelihood of institutional accumulation or distribution.
How often do SMT signals develop?
Intraday charts (5-minute and 15-minute) develop SMT signals frequently. High volume occurrences of SMT are during the London and New York session opens due to the higher institutional volume associated with these time frames.
Is there a recommended minimum account balance?
SMT is a strategy and not a financial requirement. However, considering the precision required while executing SMT, the practitioner should only trade with brokers that allows them to employ strict risk management principles (i.e. 1% per trade).
How do I determine genuine SMT signals versus noise?
A genuine SMT signal occurs when two assets do not move together at a defined "Key Level" (i.e. Daily high / low, ICT Order Block). Signals that occur in the middle of the range are often just noise.
Want to learn more about crypto arbitrage?
Get a subscription and access the best tool on the market for arbitrage on Spot, Futures, CEX, and DEX exchanges.

You might be interested

DeFi Portfolio Trackers

Dollar-Cost Averaging in Cryptocurrency

The 3 Line Strike Candlestick Pattern
