The 3 Line Strike Candlestick Pattern

with ArbitrageScanner!
The three line strike is a very rare four-candle pattern that has the potential to show a pause or complete shift in trend direction. In the fast-paced and volatile world of cryptocurrency, this pattern can help traders improve their performance by allowing them to more accurately forecast the direction of price after the pattern forms.
This guide will help you learn the three line strike; its similarities and differences for continuation versus reversal patterns, and how to best utilize what you learn from the three line strike while trading.
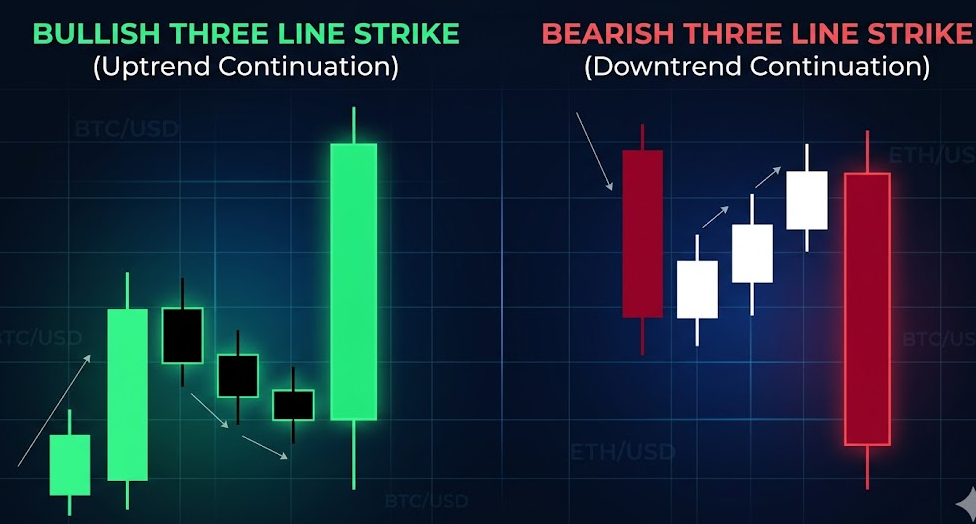
Recognizing the Bullish Three Line Strike
A bearish three line strike normally occurs when prices are in a downtrend. The three candles on the chart are three consecutive bearish (black) candlesticks (also called "three black crows") followed by one very large bullish candlestick. The large bullish candlestick (fourth from the left) creates the "strike" by completely engulfing three bearish candlesticks before it.
Four Candle Structure in Downtrends
There are four candlesticks that make up the three line strike pattern. The first three candlesticks are bearish (black) candlesticks that have lower lows. There is a downtrend in the market as demonstrated by the three lower lows of these three bearish candlesticks. The fourth candlestick opens at or near the close of the third bearish candle and closes above the opening price of the first bearish candle, effectively engulfing the entire range of the previous three candles.
Characteristics for Visual Identification
- Three small bearish candlesticks which have decreasing closes.
- One large bullish candlestick that completely covers the previous three days.
- The large fourth candlestick has a very strong body and little or no wick.
Confusing the Three Line Strike Pattern With Other Bearish Patterns
There is often confusion among traders about the difference between three-line strikes and regular bullish engulfing candles. One difference is that three-line strikes require three consecutive candles of the same color prior to the "strike," while a "morning star" gets its name from the three candles that constitute a bottom and include a fourth candle that is the larger of the two.
Continuation Patterns Versus Reversal Patterns
Historically, many text books have always classified bearish three line strikes as continuation patterns; yet expert analysis of modern price action and studies conducted by experienced traders like Thomas Bulkowski indicate they are often used as bullish reversal patterns. Crypto leverages the strength of major support levels when a three-line strike occurs after a significant dip, thereby creating a "higher probability" of confirming a reversal signal.
Identifying the Bearish Three Line Strike
A bearish three line strike is the reverse of a bullish three line strike. In the bearish version of the three line strike, three progressive bullish candles and an overall uptrend highlight that the bulls have been in control. The large bearish candle that hits down into the bodies' respective gains of each previous candle constitutes the "strike" aspect of this bearish three line strike.
Characteristics of the Three Line Strike in an Uptrend
In an uptrend, the three-line strike candlestick pattern consists of three consecutive bullish candles—often identified as white and/or green. These three consecutive bullish candlestick configurations indicate there have been consecutive bullish candlestick trends along with strong bullish momentum. The fourth candle then represents a "strike" where a large bearish candle closes below the open of the first body. The bearish candle closes at least the same price level as the tops of the previous three days' bullish trends; however, during this same price level close it will eliminate all three days of net gain in one day.
Visual Identification Criteria
When you look for three candles with a strike, please ensure the fourth is larger compared to the previous three candles in size. This formation is a good visual representation of a “liquidity grab” or “shakeout” of long positions on a daily chart.
Reliability of the Three Line Strike
The three line strike tends to have the best performance within trending markets. The pattern is less frequent in sideways or choppy markets, and as such could generate false signals. The rule of thumb is the pattern is more reliable when the strike is occurring with indicators like a 50-day or 200-day EMA.
3 Line Strike Market Psychology
Understanding the psychology behind the market sentiment is a major factor in predicting the effectiveness of the strike. The first three candles indicate the herd mentality where everyone is either buying or selling in the same direction and an overextended situation occurs as a result; and this situation creates places of maximum greed and maximum fear.
The fourth candle is the most important candle in this pattern because it indicates a “trap” formation. For a bullish three line strike, the bearish candle traps the late buyers who entered at the top of the move. For a bearish three line strike, the bullish candle squeezes the short sellers, forcing them to cover their positions, causing additional momentum in the reverse direction.
Best Practices For Trading Using The 3 Line Strike Pattern
In order to use the three line strike as a trading pattern, you must wait for the close of the fourth candle. Entering before the close of the fourth candle is dangerous because of the volatility of the market. Successfully using the three line strike also requires real-time data and patience along with an efficient trading platform.
- When to enter a trade: Enter the trade immediately upon the opening of the 5th candle.
- Stop-loss position: Right above/below a wick on the 4th candle.
- Take-profit target: Fibonacci retracement levels or next significant support & resistance zones.
This pattern makes it easier to optimize RR because the strike candle creates an easily identifiable price boundary for invalidating your trade. Most professional trader strategies look for a minimum 1:2 risk-reward ratio when trading this pattern.
Increasing the reliability of the three line strike pattern
Do not trade the three line strike candlestick pattern alone. Use confirmation from other indicators such as the RSI/MACD to increase overall performance of your trading plan. Additionally, volume analysis is key; volume on the 4th candle should ideally be greater than the first three candles combined.
Using a multi-timeframe trading approach is highly recommended. If you see a bullish three line strike on the 4-hour chart, it is recommended to check the daily chart to confirm you are trading with the overall trend (as opposed to against it). For best results, the three line strike should also occur in tandem with oversold/overbought market conditions.
Three line strike trading risk management
Due to the inherent risk of trading (especially in crypto), managing risk is an absolute must. Because the 4th candle is significantly larger than all three previous candles, a trader's stop-loss may also need to be larger than usual. Modify your position size accordingly so that you are risking no more than a total of 1-2% of your total trading capital per trade.
In addition, you can help to guard against false breakouts if you wait until the price has retested the mid-point of the strike candle. Also, consider taking some partial profits, which will allow you to lock in gains as the reversal or continuation either moves toward your ultimate target.
Limits and Challenges of The Pattern
The most significant limitation is that the three-line strike pattern is one of the least common formations in candlestick charts; it will not appear typically throughout the course of each trading day. In addition, during periods of very high volatility, the fourth line may have the potential to become so sizeable that the risk to reward ratio becomes unfavourable.
You will only be successful with the utilization of the three line strike pattern through a continual improvement process via performance analysis. Use a trading journal to keep a record of how the three line strike candle pattern performs across various coins such as BTC, ETH, or SOL, for example; each asset has its "personality" with respect to volatility signature.
Summary
The three line strike candlestick pattern represents an advanced tool for traders that utilise price action methods of trading. The fourth candle, which provides an indication of whether it results in a reversal or a continuation of a bearish or bullish market, also gives the trader an insight into the overall dynamics of the marketplace at the time of its formation. By implementing sound risk management and using the candlestick pattern in conjunction with technical indicators, your probability of success with patterns such as the three line strike candlestick will be significantly improved and successful. Remember, the three line strike candle possesses the characteristics of both being a candlestick and representing the story of the market reaching exhaustion from the trends and experiencing an extended reversal from the characteristics of price movement.
FAQ
How does the performance of the 3 Line Strike pattern for cryptocurrency compare to more traditional stock markets?
In the cryptocurrency marketplace, many of the three-line strike patterns tend to be somewhat more volatile. The "strike" candle is usually going to be much more aggressive and/or pronounced due to low liquidity and 24/7 trading, therefore creating far more opportunities for a bullish reversal when compared with traditional stock markets.
What is the average success rate for the 3 Line Strike Pattern?
Success rates for the three-line strike vary, however, based on historical data, the pattern is considered to be one of the most reliable candlestick chart patterns available, as success rates are generally between 60% and as high as over 70% following a bullish/bearish confirmation with high trading volume.
What indicators provide the greatest confirmation for 3 Line Strike?
Volume is the most effective tool to confirm a three-line strike. Also, the 20-period moving average and the RSI can also assist in determining whether or not there is a trend exhaustion at the time of formation of the three-line strike.
How can I adjust the strategy when the markets are extremely volatile?
Reduce position size. Because of the ability for the fourth candle to have high volume, the "normal" stop loss may be too far away from what you are comfortable risking thereby risking far too much of your overall trading account balance.
What timeframe has the best chance of being effective with this pattern?
The 4-hour and daily charts are the most effective. Conversely, the lower timeframes such as the 1-minute or 5-minute, will create long false signal opportunities due to meaningful noise in the market place at that time.
Want to learn more about crypto arbitrage?
Get a subscription and access the best tool on the market for arbitrage on Spot, Futures, CEX, and DEX exchanges.

You might be interested

RSI Divergence in Cryptocurrency Trading

Grid Trading in Cryptocurrency
Dollar Cost Averaging (DCA)
