HYPE's Monthly Unlock Cliff: Reading the Supply Overhang Hanging Over Hyperliquid's Token

with ArbitrageScanner!
The emission schedule of a token provides the specifics of the new tokens that will be added to the supply and when they will be paid. Future supply influences the price of a token today and should not be viewed as background noise. HYPE from Hyperliquid has a defined supply of 1 billion tokens, 61% of which will remain locked until at least mid-2026. Tokens released under the vesting schedule will follow a series of monthly releases starting on the 6th of each month, on a one-year cliff followed by a linear vest. In order to understand the unlock schedule of a token, it is important to identify the locked versus locked supply; the cliff versus linear vesting; sizing the overhang for demand; and monitoring on-chain transaction flows which can be used to see if newly available tokens have been staked/held or sent to an exchange for selling.
When discussing the value of a coin, traders commonly describe a coin as either cheap or expensive. However, one measurement of value is not complete without using both price and supply. While today's price might classify as decent value, the future supply of the coin could be subjected to consistent selling pressure from long-term vesting contracts. The future supply can be determined from the emission schedule, and therefore learning how to read an emission schedule correctly is crucial to performing asset analysis.
HYPE from Hyperliquid is a practical example for practicing these skills. On June 6, 2026, a large quantity of core-contributor tokens were inserted into supply as part of HYPE’s typical monthly tranche; at this time, HYPE traded near $59 (down about 12% since the prior day) and was significantly off its (then) all-time high of $75.48. Over 61% of the token’s total supply remains locked and will unlock through to 2027 and beyond, exemplifying the importance of both the emission schedule and price charts for such tokens.
This document does not discuss specific trading opportunities; instead, it instructs the reader on a “skill” -- specifically, how to evaluate supply overhang for any token’s emission and unlock schedule. Therefore, we will use HYPE as the case study (with publicly available tokenomics, consistent emission pattern, and currently accessible/emission structure through mid-2026) for this purpose.
Total supply versus circulating supply: the first thing to separate
The first issue to understand relates to total supply versus circulating supply when evaluating the emissions and unlock schedule for a token. The most common error made by less experienced analysts is to read the market capitalization based on circulating supply of the token only; however, two different measures need to be evaluated and both give contrasting results.
Circulating supply represents the amount of HYPE that is historically, currently, or in the future traded publicly. When circulating supply is multiplied by the trading price of HYPE ($59), the result is market capitalization which represents HYPE's value based on market demand, or available tradable supply.
Total supply, or fully diluted supply, represents the total number of HYPE tokens that are expected to exist at the end of the unlock schedule. When total supply is multiplied by the trading price of HYPE ($59), the result is called fully diluted value, and represents the total potential market value of HYPE based on the total supply of HYPE. The difference between market capitalization (from circulating supply) and fully diluted value (based on total supply) can be thought of as the amount of HYPE that remains to be unlocked.
For HYPE, there are 1,000,000,000 tokens in total supply. Currently, approximately 46% of the circulating HYPE supply is actively trading, with 61% of the total supply still held within future vesting periods. All supply data will come from differing dates and definition categories, so you must factor in the date and source of each supply value before trying to create an overall sum of 100% of the supply, as you will almost never arrive at that number. Ultimately, the point to take away is that HYPE has a large amount of supply that is not currently available for trading. Therefore, look for the FDV to get an idea of how that future supply may affect the price of the HYPE token once it is made available for sale.
Cliff Vs Linear Vesting: The Shape Of The Overhang
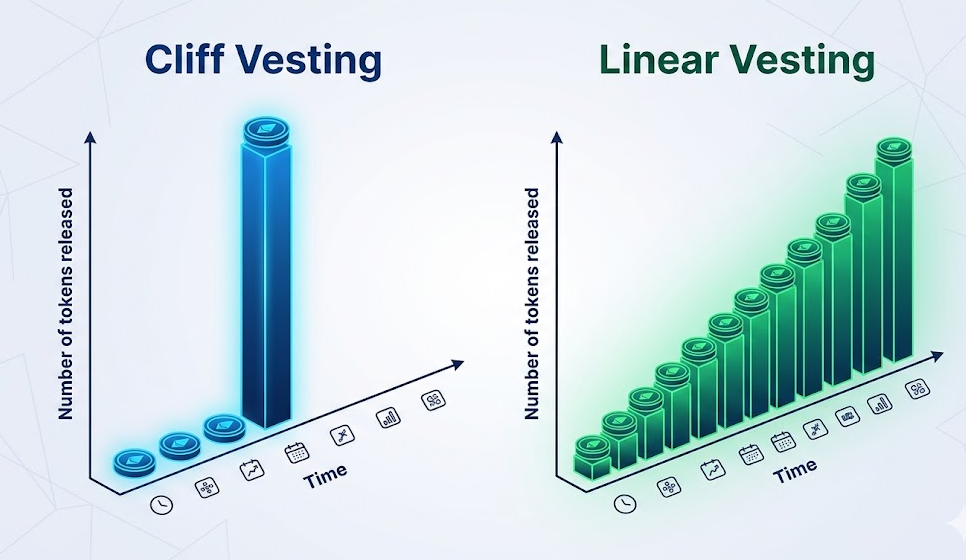
It is important to consider the shape of how the locked supply is released and not just the total amount of locked supply or how much supply is released. There are two basic shapes of release schedules, and the real world has many variations of combining those two basic shapes.
A cliff is when none of the locked supply is able to be sold until a specific date when all of the supply becomes available for trade at the same time. Because of cliffs creating discrete dates, they have very concentrated supply at a small point in time on which the market is focused on determining the number of potential sales from the cliff date.
Linear vesting is when the locked supply is released equally over a set time period, for example daily, weekly, and monthly. Again, with this type of release schedule, the overhang is much more evenly spaced out over the time required to complete the entire vesting schedule and therefore, there is not one highly concentrated date when all or most supply is released to the market.
HYPE's core-contributor allocation uses both of these release methods. This allocation was released with the first year of the core-contributor vesting period being in a cliff and after that, HYPE's core-contributor allocation will be released on a linear schedule throughout the remainder of the core-contributor vesting periods until approximately 2027-2028 when all of its core allocations will have released. Starting in January 2026, a monthly version of an event (tranche) began occurring on the 6th of each month; as such, the June 6th event was not a surprise, but rather an expected monthly cadence event that will continue to happen over the next few months/years until all HYPE's near-term supply has been released. This monthly pattern is not the result of a one-off clearance (i.e., there are no more gains to be had) nor is it an unbroken, continuous release of supply (i.e., there will not be any new additions of value); instead, it will occur every month, providing additional new supply for the marketplace until the entire supply has been distributed.
Supply structure and release cadence for HYPE
Below is a summary of HYPE's Tokenomics; all dollar and timing notes below refer to the mid-June 2026 snapshot above, which illustrates the individual allocation and timing characteristics of HYPE's total supply of 1 million units.
| Allocation Bucket | Allocation Percentage (%) | Release Character |
|---|---|---|
| Community Rewards and Future Emissions | ~38.89% | 3-year, gradual release schedule |
| Genesis Distribution (I); Initial (Air drop). | ~31.00% | The majority of the distributions were made at launch |
| Core Contributor/Founders | ~23.80% | One Year Cliff followed by linear distribution over approximately a 24-month period |
| Hyper Foundation/Budget | ~6.00% | Operational/Ecosystem resale transactions |
| Community Grants | ~0.30% | Discretionary use |
| HIP-2 (Hyper liquidity) | ~0.01% | Protocol liquidity mechanism |
Analysing this table from the analysts' standpoint one might come across a few major takeaways:
- The majority of HYPE's total supply was previously circulating prior to today's announcement; approximately 31% of the circulating supply was awarded to users who registered for the genesis air drop (most of which were directly awarded); when compared to the more commonly found supplies; this creates a much different profile as HYPE's total supply will be much greater than most similar tokens that are seldom distributed. In addition, since Hyperliquid did not raise money from traditional VC firms, there is no historic "seed round/VC" (as most tokens), which means there will not be any of this traditional source of selling pressure.
- The next bucket to consider is approximately 23.8% of supply (corresponding to 237M-238M HYPE), referred to as the core contributor bucket. This is the bucket that currently supports the monthly cadence. Therefore, the tranche tracking is important because there have previously been notional amounts greater than hundreds of millions of dollars linked to monthly events in this sequence (the last reports around June showed $300M+ amounts for each tranche at the market price on the report date).
- The largest bucket (the single largest bucket) - future emissions and community rewards - at almost 39% is the largest single tranche and has the longest tail. This supply will also be the slowest burning if you look at it over the period of time before reaching the edge of the contributor cliff, and it could easily be overlooked since there isn't any dramatic single date associated with it.
Sizing the overhang: supply is only half of the equation
To size the amount of excess supply, supply is only half of the equation. A monthly tranche does not automatically create a bearish effect. Whether a tranche is bearish or bullish will depend on the balance of new supply coming in and demand coming in to absorb the new supply or any effect on the price as a result. Thus, analyzing the schedule and performing an analysis of the market should lead to a better understanding of how likely a tranche is to cause either bearish or bullish price action.
You can ask the following mechanical questions when performing your analysis:
- What is the size of each monthly tranche versus average daily volume? A tranche that represents one-fourth of one day’s volume will be very easy to digest; a tranche that exceeds all daily volume will be very difficult.
- Is there a demand source on the other side? Hyperliquid has made a remarkable effort to build its network. Approximately 99% of its trading profits will be channeled into an Assistance Fund, utilizing funding to purchase HYPE on the open market. Over time, this fund has accrued around 44 million HYPE tokens, with the added power of earning about $140-$160 million annually from the reserve yield on its USDC balance. Standing buy-side demand through this protocol revenue is a countering force to the volume created through unlocks.
- Are locked tokens issued after an unlock required to be sold? Token holders do not have to sell their unlocked tokens. Locked tokens are not sold like their unlocked versions. Token holders will have multiple options for their converted HYPE, which will include holding, staking, or selling, and the granularity of the release schedule will not inform us of how they choose to manage them.
Reading on-chain flow: do the unlocked tokens get sold?
Are the system’s unlocked tokens being sold as evidenced through on-chain flow? The emission schedule identifies when HYPE tokens will theoretically be available for distribution, while on-chain provides us with clarity on what holders are actually doing with their HYPE. The difference between the two will generally give you one of the strongest signals to indicate the nature in which a scheduled unlock takes place; scheduled unlocks of HYPE that result in holders staking their HYPE will have huge differences from scheduled unlocks that expect holders to send HYPE straight to the exchange.
When analyzing newly unlocked tokens, there will be three primary behaviors to identify:
Delegated Staking. Holders of HYPE will have the opportunity to delegate their HYPE to validating nodes, thereby allowing them to earn rewards that will compound as well. HYPE that goes through the process of unlocking and staking are not immediately being sold, at least until they decide to move through the exchange. The movement of unlocked balances into staking provides a direct indication of near-term selling intentions, with delegation indicating that the token is being held or not actively traded.
In the case of tokens sitting in a recipient’s wallet after being unlocked, they represent latent supply — claimable and transferable but currently not being traded. Therefore, such tokens are worthwhile to track, as they may be a future source of selling pressure; however, they are not currently applying pressure on the price.
When tokens move from a vesting or recipient wallet to a known centralized exchange deposit address, such transactions represent the best on-chain proxy for someone's intent to sell. Most people make deposits into centralized exchanges in order to trade or liquidate their holdings. A spike in unlocked token inflows to the exchange wallets just after an unlock date is one of the primary indicators that seasoned analysts follow.
Furthermore, reporting has also stated that, for HYPE, the core contributors’ actual on-chain claims have historically been significantly lower than the maximum allowable under the vesting schedule. Some accounts report that core contributor claims historically have been more than 90% below the maximum allowable level under the vesting schedule. In other words, recipients have not claimed or moved the full amount of their theoretical entitlement, even though the vesting schedule defines what could be unlocked and claimed. Thus, flow data and not merely the calendar should be relied upon, as the calendar is merely the highest potential amount that could be unlocked and claimed, while the chain represents the actual reality of what has occurred.
The same type of ability to analyze wallet-level activity is also useful for tracking whales and any type of insider trading activity. Arbitrage Scanner's AI Wallet Analysis Tool assesses 272 characteristics of all addresses, giving a potential lens to determine whether unlock recipients are accumulating or distributing prior to a move (i.e. price candle) rather than basing judgement solely on price activity and charts.
What the overhang means for HYPE over 2026-2027
Combined, the open supply structure of HYPE over the remainder of 2026 and through 2027 show a structured form as opposed to all supply recognizing only a single outcome.
On the supply side, contributors follow a consistent monthly cadence to release supplies as of the 6th of each month, while rewards from the community rewards bucket continue to allow for additional supplies beyond the monthly contributor supply. The supply creation date returns monthly, and the market responds to the monthly return; the single-day price movement of around 12% during June exemplifies this due to its price rise that month (the date provided). The supply-related activity monthly represents an event that the market receives timely and appropriately.
On the demand side, buying initiated from the Assistance Fund provides structure for opposing support for supply activity through revenue; the Assistance Fund grows in structural purchasing activity with increases in trading volume. Accordingly, the interplay of these two opposing forces settles in a defined way for the period looking backward. In conjunction with fee-driven buybacks, the volume of fee-driven buybacks, and length of lockup by staking, provides opposing force on the monthly supply. The market place interest and price activity (tranche size, trading volume, fund activity, and exchange inflow) during a current month will determine which side of the supply/demand equation is generally more substantial in a month; these parameters are not defined by the timing of the original issuance of any supply within that month.
The relevant thoughts or ideas for those considering arbitrage opportunities via HYPE result mainly from the second-order. Unlock dates focus volatility into concentrated areas which show up in Derivatives through funding rate swings, widening of perpetual basis and expanding spreads between venues as flow of funds becomes one-sided due to an impending known event. In order to view how a misaligned derivatives market exists heading into a supply event you can use a Futures and Funding screener to view funding rates across exchanges and perpetual market against calendar date.
As such a supply unlock schedule is itself a forward calendar, it is important to view a Listings and Events Calendar to identify upcoming supply events for the tokens of interest.
Takeaway Check List: A repeatable checklist for reading any emission schedule
The HYPE scenario generalizes: every time you review an unknown token you need to ask the same questions:
- What is Total Supply Vs Circulating Supply, how large is the gap (FDV Vs Market Cap)?
- Who has the locked Supply i.e. Team, Investors, Community, Treasury, what proportion do they hold?
- How will the Locked Supply be released, (e.g. Cliff, Linear Vesting, Recurring cadence), what are the release dates?
- How will each tranche relate to Daily Volume?
- Is there a Structural Supply Demand Sink, such as buybacks, staking, or burns, existing on the other side of the Supply?
- What are the On-Chain Transactions, for example; Staking, Holding, Or Sending To Exchanges Where Unlocked Tokens Are Being Sent After Being Unlocked?
By answering these six questions you will have properly evaluated the Emission Schedule, not as a single Bullish or Bearish label; rather as a map to where the Supply is from and what to anticipate concerning its Delivery Process. Bitcoin, the original cryptocurrency, was issued slowly for a long time until new units replaced some old (with no insider bonuses). Ethereum issues only small amounts of new ether and destroys some new ethers that have already been created. Whereas some tokens are being issued quickly with no regard for the above two examples, there are good reasons to read the new token's release schedule carefully.
Commonly Asked Questions
What's the HYPE Token's Unlock Schedule?
The HYPE Token (Hyperliquid) will have a maximum issuance of 1 Billion total tokens. Approximately 23.8% of HYPE were distributed to core contributors; this represents 237-238 Million HYPE that were subject to a 1 year cliff, followed by a linear vesting. HYPE is now being released according to a set monthly release schedule (every 6th day of each month's beginning of each month between 2026 and 2027; as of mid-2026 about 61% of the HYPE total remains locked).
What Is The Difference Between Total Supply And Circulating Supply?
The circulating supply of a token is defined as that quantity of the token which can be traded freely at this particular time (presently) within the marketplace. The market cap of a token is calculated by multiplying the circulating supply by the current price of that token. The total supply (fully diluted supply) of a token represents the maximum number of tokens of that token that will be created throughout the entire lifecycle of that token. The fully diluted value (FDV) of a token is equal to multiplying the total supply of that token by the current price of that token. Consequently, any difference between the market cap and FDV of a particular token represents the number of tokens that will be unlocked in the future - thereby resulting in dilution to the current circulating supply of that token.
What Is The Difference Between A Cliff VS A Linear Vesting?
A cliff represents a specific date that occurs prior to which no tokens are available for claim, at which point a substantial percentage of tokens become available for claim in a single period of time (e.g., 100%). As a result, the total allocation of available tokens can be concentrated into a small period of time, as opposed to being distributed evenly throughout multiple periods of time (e.g., over several months). Tokens that unlock may not necessarily cause a price drop due to a lack of actual sales. Since the price decrease depends on the token's demand in relation to supply (by either waiting until it is staked/held or sold), the actual number of unlocks does not impact price if unlock supply is offset by demand.
How do you tell if unlocked tokens are about to be sold?
You may look for on-chain movement of tokens that unlock into outer wallets versus being used as staked assets. The most telling signs of intent/pressure to sell tokens right after an unlock occur when there are strong increases in inflows to known CEX deposit addresses. Therefore, watching for spikes in exchange inflows during scheduled unlocks would be a good indication of whether or not to expect sell pressure due to an unlock.
Why does HYPE have no venture-investor unlocks?
HYPE has no venture investor unlocks as Hyperliquid does not raise venture capital funding; rather, it has given away about 31% of supply directly to users through a genesis airdrop. Because HYPE has distributed so much supply to end users, it does not have the traditional seed/private investor unlocking waves like so many other tokens have experienced. The only major contributor of schedule date overhangs is HYPE's core contributors.
Try ArbitrageScanner free for 1 day — get access to the full crypto arbitrage toolkit, including the perp and funding screener, spread-history charts, and AI wallet analysis across 80+ exchanges.
Educational purposes only. Not financial, investment, or trading advice – cryptocurrency is very volatile; and trading cryptocurrencies is very dangerous and carries a high risk of loss of your investment. Supply, unlocks, and tokenomics are sourced from publicly available data up until mid-June 2026, and data is subject to change; therefore, always verify and verify current data and any actions you may take on it. Respectfully, nothing in this document should be taken as a recommendation to buy, sell, or hold an asset. Additionally, ArbitrageScanner is a software company that provides no API connection to your account, or in any other manner; you have complete control and ownership of your capital all the time. Always do your due diligence and research before you make a decision to invest.
Want to learn more about crypto arbitrage?
Get a subscription and access the best tool on the market for arbitrage on Spot, Futures, CEX, and DEX exchanges.

You might be interested
Reading Funding Rates the Right Way: Why LIT Stayed Positive Through a 20% Crash
Thetanuts $2.1M Flash-Loan Exploit: How a Low-Supply Rounding Bug Let an Attacker Mint Tokens for Free
How to Vet a Crypto Exchange Before You Deposit: A Counterparty and Sanctions-Risk Checklist
