Bull Flag Chart Patterns

with ArbitrageScanner!
Finding different signals in order to find trend opportunities in the markets can be one of the hardest things to become consistently successful in the markets as it relates to trading cryptocurrency. A bull flag chart pattern is considered one of the best continuation patterns for traders as it shows they are in the original uptrend, which has now gone sideways (consolidated) for a short period of time.
Whether you are day trading bitcoin or swing trading altcoins, once you learn to identify bullish flags and their corresponding entry/exit signals, then you will be able to trade with a higher level of confidence and have clearly defined risk. This guide will provide detailed information on identifying, validating, and ultimately trading bull flag patterns related to the specific nature of the cryptocurrency markets.
Understanding the Bull Flag Chart Pattern
In technical analysis, a bull flag chart pattern is defined as a strong price increase (the pole) that occurs prior to the establishment of a short-term, downward-sloping price channel (the flag) that holds prices within a small range while the market digests its recent price advance before continuing higher. Bull flags are an indication that buyers are still in control and are waiting for the best time to enter the market at a higher price.
What Defines a Bull Flag Pattern in Technical Analysis
Bull flag chart patterns develop from a large imbalance of supply and demand. Bull flags will consist of two visual parts. The first part will be a very strong upward movement (strong price increase – flagpole) followed by a slower downward movement (diagonal downward movement – flag) while meeting within a small range without retracing more than 50 percent of the original price increase. In case of a deep retracement, the bullish flag pattern could fail or instead change into either a larger consolidation area or a trend reversal.
The Psychology Behind Bull Flag Formations
The psychological component of the bull flag is the market sentiment or the participants' profits taken. Once there is a large rally, early participants begin taking profits, resulting in a small dip in price. However, since sentiment is still bullish, participants will be looking to buy into the market during this dip which will stop prices from crashing. Therefore, there is a tug-of-war that creates the bull flag, and once all selling pressure has been exhausted there will be a bullish breakout as previously sidelined capital rushes into the market due to fear of missing out on the next price surge.
Bull Flag vs. Other Bullish Continuation Patterns
The bull flag pattern is a trend continuation pattern; however, bull flags and bullish pennants are frequently confused. The biggest distinction is the shape of the two patterns; the bull flag is rectangular and slants downward while the bullish pennant is triangular and converges into a single point. In addition to the two aforementioned patterns, a flat breakout pattern exists with a horizontal resistance line. Understanding the difference between these three patterns is crucial for different trading environments; typically the bull flag provides traders with more definitive entry signals than the bullish pennant.
The Three Critical Components of a Bull Flag Pattern
In order to be effective in trading a bull flag, you must identify the three underlying structural characteristics that define the validity of a bull flag pattern. A valid bull flag must have all three of the critical components to be classified as a high-probability trading opportunity.
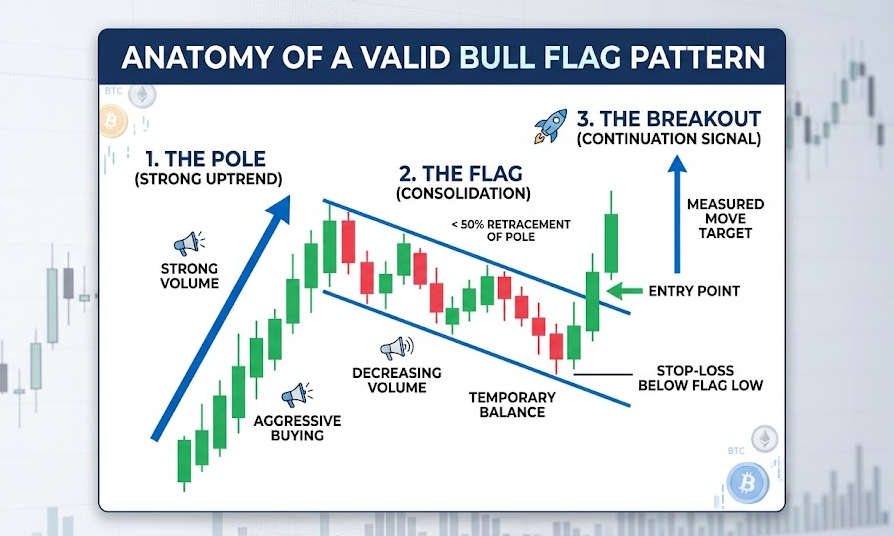
The Pole: Strong Initial Upward Movement
The pole is the base of all chart setups; it tells the trader that a lot of volume was traded and a lot of demand bought up the coin very quickly. In crypto, this happens with big news announcements, a technical breakout or a huge amount of short-covering. The pole height is very important for the trader to determine how to calculate their ultimate profit target when the pattern is finished.
The Flag: Consolidation and Correction Phase
After the pole, the flag comes into play. The bull flag is made up of two parallel trendlines that slope in the opposite direction of the preceding trend. It is very important for the flag to be forming on decreasing volume, which indicates that the selling force is losing strength. A flag represents an area of temporary balance. If the price breaks out above the flag's upper trendline, it confirms that the area of consolidation has officially ended.
The Breakout: Continuation Signal and Entry Point
The breakout is the "go" signal. The breakout occurs when the price breaks through the upper trendline of the flag. If a trader is using a bull flag strategy, ideally the breakout will occur on an increase in volume. The breakout from the bull flag shows that the trader's bullish flag pattern worked, and that the pattern is valid for continuation.
How to Identify a Valid Bull Flag Pattern
Not all areas of consolidation are going to be a flag; the use of pattern recognition to identify a flag in the volatile crypto market requires discipline to follow the rules, and avoid "fakeouts." Traders must wait for the flag to fully create itself before putting their money into it.
Volume Analysis for Pattern Confirmation
The "fuel" to drive upward movement on a bull flag is volume. Volume is ascending during development of the pole. While the flag develops, volume should decrease. The decreasing volume during flag formation indicates that the bears lack conviction. The volume will increase dramatically when the price breaks above the flag’s upper trendline, confirming the resumption of the upward trend.
Price Action Characteristics During Formation
A flag pattern should have a square shape. A normal upward bull flag pattern should never have more than a 38.2% price decline (retracement) of the pole. If a flag pattern has a price decline exceeding 50% of the original price at the beginning of the flag, then the flag will have a weak probability of a continuing trend.
Timeframe Considerations for Pattern Validity
Bull flags can form at any time and on any candle (1 minute through 1 month). In the cryptocurrency markets, the most reliable timeframes for forming bull flags are 4 hour and daily candles. Shorter timeframes (1 min-1 hour) may have false breakouts of bull flags where price bounces may not break through previous levels.
Common Bull Flag Variations in Crypto Markets
In the cryptocurrency markets, there is also the “High and Tight Flag” bull flag which is formed during parabolic price moves. The high/tight flags, compared to regular bull flags, are square and represent the highest level of accelerating bullish price action. In addition, by identifying frequently occurring patterns, traders will be able to participate in the largest price moves in the market.
Step-by-Step Bull Flag Pattern Recognition Process
Mastering how to trade bull flag patterns takes a methodized approach. Follow this fool-proof step-by-step process to make sure you identify potential trading opportunities as accurately as possible.
Identifying the Initial Uptrend and Pole Formation
When you find a bullish flag pattern on a price chart, you are looking for a long vertical bar (pole) that has created an upward movement and formed a flat top. This is the first part of trading the setup; you have recognized that the marketplace has been creating the "discovery" phase of price with aggressive buyers.
Analyzing the Consolidation Channel
After the top of the flagpole has reached its pinnacle, look for the building phase of the flag formation by using two parallel lines drawn connecting the highs and lows of each subsequent temporary high/low. The formation of the bullish flag pattern relies upon these channels remaining parallel within a small percentage of each other; otherwise, the top of the flagpole will have continuously made higher highs and would no longer qualify as a flag (different type) or a channel.
Setting Breakout Levels for Entry Signals
The bullish flag is located at the actual resistance level. Place an alert just outside the upper (top) trend line of the bullish flag. Most trading strategies that utilize bullish flag patterns will only initiate the position once the preceding candle has closed higher than the upper trendline (broken out) for entry confirmation.
Pattern Duration and Expected Completion Timeframes
A flag is not meant to last indefinitely. If the duration of consolidation is too long, the bullish flag will lose its momentum from the pole. A bullish flag pattern in "cryptocurrency" generally resolves itself within 5 – 20 candles, depending on the timeframe you are trading (5 = a very short time period; 20 = longer). If a bullish flag takes longer than expected, the pattern may suggest a neutral change in trend direction.
Trading Strategies for Bull Flag Patterns
Successful trading strategies include more than just detecting the bull flag pattern; they involve accurate execution as well as detailed plans for exiting a trade. Here's how to trade a bull flag professionally.
Optimal Entry Point Determination
When trading a bull flag pattern, you have two options. The first option is to enter as soon as the price breaks out through the top of the flag. The second option is to wait for the price to retrace back to the flag and then enter after the retracement meets your entry criteria. Each of these two methods has its pros and cons concerning slippage and/or certainty around the entry point.
Stop-Loss Placement Techniques
When trading using this trading method you will want to protect your capital by using proper size. You must determine the area in which your trade would be considered a loss. Common stop loss placement for the bull flag pattern is just below the lowest point of price on the flag. When trading bull flags tightly, you can put your stop loss order just below the most recent swing low within the flag.
Calculating Profit Targets Using Measured Moves
The bull flag pattern suggests a profit target based on the measured move principle. To calculate the profit target, measure the distance from the start of the flagpole to the highest point of the bull flag. Project that same distance from the breakout point to find your profit target.
Using Volume as a Confirmation Tool
You cannot ignore volume; if the breakout occurs on low volume, it's likely just a "false breakout." You will want to see substantial volume (volume spike) during the breakout of the bull flag pattern and the price movement preceding the breakout. It means that the technical analysis indicator shows successful patterns with large financial traders backing them.
Risk-to-Reward Ratio Optimization
One good part of trading bull flag patterns is that they have a small risk-to-reward ratio because the flag portion is typically much shorter than the previous pole. The small amount of risk involved when setting your stop-loss, combined with the potential profit from the measured movement from the flag will make it an attractive trade with ratios of between 1/3 and 1/4.
Risk Management When Trading Bull Flags
Even a perfect bull flag pattern can fail! The main separation in profitability among traders is managing their risk.
Protecting Capital with Proper Position Sizing
Due to crazy price action within the crypto market, it does not make sense to use your total available account size in any one single bull flag chart. Use the proper position size to only risk 1-3% of your total trading account, for instance, so that if the pattern fails or is misread and your stop-loss is triggered, your account will be affected minimally.
Handling False Breakouts and Pattern Failures
False breakouts occur when price action resembles that of an actual flag breakout but results in price immediately reversing back down. Many times throughout our experience with crypto, this chart pattern has been used to "hunt" liquidity. Exit the trade if the chart pattern differs from the breakout level. Many traders experience the traps of false breakouts via their attempts to trade the bull flag pattern; this is especially prevalent when focusing on low liquidity altcoins.
Trailing Stop Strategies for Maximum Profit Capture
When entering into the bull flag trade goes in the direction you were hoping for, consider using a trailing stop order. You can lock in your trades and let your total gain exceed any limit. A trailing stop will help protect your profits during periods of volatility in the cryptocurrency market by preventing you from losing too much money on any given trade as Crypto trends may exceed the “measured move” target.
Adjusting Expectations for Crypto Market Volatility
In cryptocurrency, the bull flag shape occurs more aggressively than in stocks and you should be prepared to see "wicks" (the long tip of a candle) that may just hit below the flag line. You should confirm the bull flags using "closing prices", on longer time frames (days to weeks), instead of following every small price fluctuation every single hour.
Practical Examples of Bull Flag Patterns in Cryptocurrencies
Let’s look at examples of how to use the bull flag pattern when determining if a cryptocurrency is a good entry or if the trade is a long hold or exit via successful trade outcome.
Bitcoin Bull Flag Case Studies
During the Bitcoin Bull Market in 2021, Bitcoin completed a number of bull flags. Bitcoin went from $30,000.00 to $40,000.00 (the pole), then dropped to a lower channel until breaking out again (the flag) to $60,000.00. All of these bull flag patterns provided examples of potential entries that corresponded with institutional accumulation.
Altcoin Bull Flag Variations
Alternative coins frequently exhibit “over-extended bull flags,” for example, Ethereum may create a bull flag that will look like it is failing because it has dropped back down to below 50%, however, in the end, it will actually go back up. As it relates to alternative coin bull flag alternate examples, you will need to be more flexible with your technical analysis parameters since alternative coins are known to be more volatile than Bitcoin.
Pattern Performance Across Different Market Cycles
The bull flag pattern is a continuation pattern and can be expected to perform best during a "markup" phase. In a bear market, less reliable bull flags will form because the overall market will be bearish. Bear flag patterns will form and succeed in this situation more frequently than bull flag patterns.
Integrating Bull Flags into Your Trading Plan
You won’t find successful trades for the long term based solely on buying or selling with only one pattern, but by adhering to a systematic methodology.
Combining Bull Flags with Other Technical Indicators
If you want to increase your success rate of trades, trade with another indicator, such as the relative strength index (RSI). For example, if a trader identifies a bull flag chart and the RSI is still in the oversold position, the odds of a successful breakout are significantly improved. Many patterns that traders utilize will produce when they are trading in “confluence”.
Building a Systematic Approach to Pattern Trading
Trading patterns on their own is equivalent to gambling. Create a checklist of criteria that must be met before executing trades on bull flag patterns. For example, does the bull flag have a pole? Is the volume declining? Is the overall crypto market in an uptrend? Only if all of these criteria have been satisfied should the trader enter the trade.
Record-Keeping and Performance Assessment
Maintain a journal of all bull flag trades including a date of entry, date of exit, and reasons why a bull flag did or did not achieve completion. Analyzing this data will help you to see how well you’re able to identify flag patterns on various asset classes and in various time frames.
Continuous Improvement of Pattern Recognition Skills
Markets change over time. Performing historical (backtesting) price pattern analysis will enhance your ability to identify bull flags vs bearish flags using the outcome of each pattern. The more pattern types you are able to identify as possible entry points, the more quickly your intuitive ability to trade will improve.
Conclusion
The bull flag pattern is a valuable long-term trend-following pattern providing cryptocurrency day traders with a low-risk, high-return opportunity. Understanding how the pole, the flag, and the breakout fit together helps you navigate the volatile cryptocurrency markets successfully. An additional consideration is that while the bull flag is a continuation pattern, it should always be confirmed through volume and broader market conditions before making a trade. When you consistently apply the trading methods outlined and have an effective risk management system in place, this widely known chart pattern can provide you with a sound basis from which to trade successfully.
FAQs
How do bull flag patterns perform in the crypto markets vs. traditional markets?
In the crypto market, bull flag patterns are typically more volatile and resolve more quickly than in traditional markets. For example, while the bullish flag pattern on the stock market may take several weeks to develop, in cryptocurrency, it can develop in only a few days (or even hours) due to 24/7 trading and a larger percentage of retail traders.
What is the historical success rate of bull flags and their respective outcomes within cryptocurrency trading?
A valid bull flag that meets all requirements in terms of volume and retracement will generally have a win rate between 65% and 70%. However, the overall trend in Bitcoin has a tremendous effect on whether the bull flag continues or fails.
What are the adjustments traders should make to their bull flag trades during different crypto market environments?
In a bull market, you can afford to be more aggressive with your profit targets. In a bear market, you must be careful because the bull flags may fail and become bear flag traps. When you buy bull flags that develop in bear markets, you must utilize much tighter stop-loss orders.
What are the leading causes of the failure of bull flag patterns and how can traders identify them before they happen?
The leading causes include a lack of volume at the breakout and a deep retracement. If the price breaks out of the flag, but does not have enough power to continue up, it is an indicator that the pattern could be failing.
How does volume affect the reliability of the bull flag formations in the crypto market?
Volume is the final confirmation of a bull flag. A bull flag will only form properly if volume "dries up" while it is in the flag stage. If the price is consolidating (within the flag) and there is high volume, this indicates that selling is pressuring the price to the downside, leading to the failure of the flag formation.
Want to learn more about crypto arbitrage?
Get a subscription and access the best tool on the market for arbitrage on Spot, Futures, CEX, and DEX exchanges.

You might be interested
NFT Games

BTC vs. USDT as Quote Currency

Bitcoin Rainbow Chart Guide
