How to Calculate Your REAL Arbitrage Profit: A Full Cost Breakdown

with ArbitrageScanner!
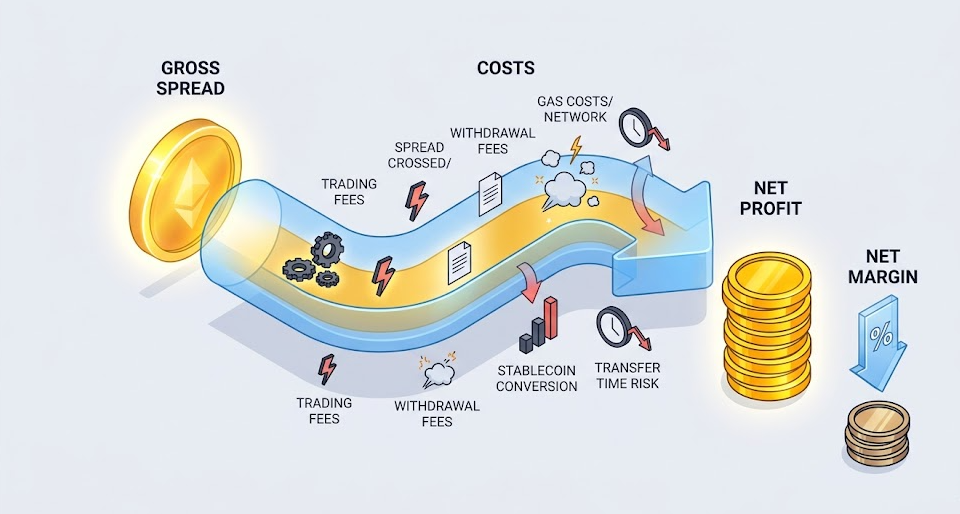
The actual arbitrage profit is defined as the difference between the headline spread and all costs incurred on both sides of the trade including: maker/taker fees (multiplied by 2), withdrawal and network fees, on-chain gas fees, slippage, the costs associated with crossing the bid-ask spread, transfer time risk, and funding costs related to trading in stablecoins. A trader should take all these costs and subtract them from the funds they have available on the buy-side before determining how much of a profit they made after executing the trade. A "1.8% spread" will likely turn into a fraction of a percent (or be negative) after accounting for all the associated costs.
When you look at the screener, you may see a liquid alt that is trading at a price that is quoted as 1.8% cheaper on a certain exchange (venue A) than it is on another exchange (venue B) at that same time. You think that through executing this trade with an initial investment of $5,000, you will earn $90 in profit for a few minutes of work; however, when the trade gets filled and completed, your total balance might only be $11 greater than your previous total, or may even show a loss of $4.
In this example of a trade that was executed correctly, the trader has paid the costs associated with the trade. Therefore, while the headline spread is gross in nature, it is not a representation of the ultimate profit; it is merely advertisement of an opportunity to trade. There are many costs associated with trading, and many beginning-level traders are unaware of how to do the calculations to account for these costs when determining whether or not they will make a profit from their trades. To help you with this process, this guide will develop a complete net profit framework for both CEX ↔ CEX and CEX ↔ DEX arbitrage along with two worked examples for liquid alts, a reusable formula, and a checklist you can go through prior to executing a trade.
What the Headline Spread Does Not Tell You
A 1.8% spread means that the quoted price on venue B is 1.8% higher than the quoted price on venue A; that's all it says. Details not included in the document include:
- Whether you can purchase at the quoted price of Venue A (most of the time you won't be able to);
- Whether you can sell into the book of Venue B without moving that much of it;
- The cost of transferring the asset or your stablecoins between the two venues;
- The price deviation while your funds are in the process of being moved.
Each one of those is a measurable cost. If you combine all of these costs, the headline of 1.8% will be 0.3%, or worse yet could be completely gone. Understanding how to arbitrage is not spotting a spread, as that's what the screener does for you. The understanding and skill of arbitrage is knowing what spreads can survive their own costs.
The Costs Nobody Counts
Below is an overview of all costs associated with all trades. Some of the costs are associated with every trade and some are associated with specific DEX or perp legs and some are associated with both.
1. Trading fees on BOTH legs. Trades have trading fees associated with both sides of the leg. When you purchase an asset you incur a fee and when you sell it you incur a fee. Typical taker fees on CEX are approximately 0.05%-0.10% on both sides of the trade. Typically Maker Fees are lower or do not exist but generally need a resting limit order that may not have had enough time to fill. When you have two taker legs that are 0.10% each, it will cost you 0.20% before you have started to move through the trade.
2. The bid-ask spread you cross. The difference between the price you buy the asset and sell the asset is known as a Bid/Ask Spread. This is the amount of price difference when you buy on market order you are buying at the Ask Price and when you sell on market order you are selling at the Bid Price. If you trade on a thin book where a Bid/Ask Spread is crossing it may be between 0.05%-0.30% each side, they will be separate from the exchange fees. It is very difficult to quantify throughout the mid trading price except for the displays of the pricing on the screens.
3. Slippage / price impact. This occurs when buying a certain amount of an asset using a market order.
4. Withdrawal / network fees. Cost of transferring coins between exchanges (centralized exchange ↔ centralised exchange) usually involves a flat fee per transaction (more than just a raw network cost). For example, if you are withdrawing $300 worth of coins and the withdrawal fee is $1.50, it means you incur approximately 0.50% fee.
5. On-chain gas (DEX leg). There are gas fees associated with trading on decentralized exchanges (DEXs). You must pay for gas to swap on DEXs. The amount of gas required to be paid comes from the native network of the DEX, and the higher the levels of traffic, the greater the amount of gas you will need to pay. Example: If you swap on a DEX that operates over a low-layer 2 network, you may pay only $0.05 in gas; however, if you swap during periods of congestion on the primary Ethereum chain, your gas costs could be as high as $40, depending on the size of your trade.
6. Transfer-time risk. This is the type of risk that will effectively kill your "guaranteed" spreads, while you wait for your coins to be confirmed on-chain and your fiat funds to be settled into the exchange's books (i.e., you may find the spread has widened, narrowed, or flipped inverted). A transaction between two centralised exchanges that takes place on fast networks should be able to avoid the risk associated with a 3-minute transfer; however, a transfer that takes place on a slow network could take 30 minutes and introduce an additional directional risk factor that was not originally intended. In such a case, you may need to pre-fund both sides of a transaction (tying up your capital) or accept that additional risk.
7. Funding cost (perp/futures leg). If your trades are performed with perpetual contracts, such as funding-rate or arbitrage trades, you will incur funding on each leg of the trade every time there is a funding interval (i.e., at times of negative funding against your position).
8. Stablecoin conversion costs. If you are holding USDC and the cheaper exchange is only quoting using USDT, you will pay fees for converting the stablecoins, typically 0.01%-0.1%, potentially higher in times of stress. This is a small amount but still exists and could be missed.
The Net-Profit Formula
When you create a net profit amount, you should be doing it based on your quote currency (for example, USDT), and based on your actual position size, and not in percentage terms — using percentage will hide a flat fee.
NET PROFIT = GROSS_SPREAD_VALUE
- buy_leg_trading_fee
- sell_leg_trading_fee
- buy_side_slippage_and_spread_crossed
- sell_side_slippage_and_spread_crossed
- withdrawal_fee (CEX->CEX asset transfer)
- gas_cost (DEX swaps + approvals)
- stablecoin_conversion_cost (if quote currencies differ)
- funding_cost (if a perp leg is held; can be +/-)
- transfer_time_risk_buffer (expected adverse drift while in flight)

where:
GROSS_SPREAD_VALUE = position_size * (sell_price - buy_price) / buy_price

NET MARGIN % = NET PROFIT / capital_deployed * 100
A couple of things to note - Transfer Time Risk Buffer is not a hard cost. It is an average haircut based on what you will likely lose. If you are transferring something from one chain that takes about 10 minutes to transfer, and your asset floats against you on average by .02%, you should budget .02% to be lost on this transfer. Also, always divide your net profit into capital deployed, to include not just the capital currently in use, but also the locking up of additional capital pre-funding both sides of the trade, or it will show a better return than it will really be.
Worked Example 1: CEX→CEX Arbitrage on an Alt
In mid June of 2026, let's arbitrage the Alt SEI, which can be bought on Exchange A for $0.500. Sell SEI (SEI) on Venue B for an illustrative bid price of $0.509 for a total of 1.8% across both trades. Your position is $5,000. You currently hold SEI on Venue A and/or have provided funding at Venue A to total your position of $5,000. You will use taker market orders for both legs with a taker market fee of 0.10%. The withdrawal fee at Venue A is a flat 2 SEI (approximately $1.00). You should transfer SEI from Venue A to Venue B on an expedited basis with a projected 2-minute transfer; budget for a maximum of 0.15% of your stake to account for market impacts caused by the transfer being the cost of doing the transfer.
| Cost Item | Calculation | USD Cost | % of Capital |
|---|---|---|---|
| Gross Spread Value | $5,000 × 1.8% | +$90.00 | +1.8% |
| Buy Leg Taker Fee | $5,000 × 0.10% | − $5.00 | − 0.10% |
| Sell Leg Taker Fee | ~$5,090 × 0.10% | − $5.09 | − 0.10% |
| Buy-Side Slippage + Spread | Thin Book ~ 0.20% | − $10.00 | − 0.20% |
| Sell-Side Slippage + Spread | Thin Book ~ 0.20% | − $10.18 | − 0.20% |
| Withdrawal Fee (2 SEI @ flat 2 SEI) | flat | − $1.00 | − 0.02% |
| Transfer Time Risk Buffer | $5,000 x 0.15% | − $7.50 | − 0.15% |
| TOTAL NET PROFIT | ≈ $41.23 | ≈ 0.82% |
The gross was 1.8%, then netting to 0.82% is still positive but is less than half of what was anticipated. Adjusting to a $400 investment will create a withdrawal fee of $1.00 or 0.25% to remove and slippage may also increase per dollar.
Worked Example 2: CEX→DEX Arbitrage on an Alt
Good Example. You will be placing a buy on SEI via DEX, then selling on a CEX, where gas fees will be the only difference because of how the two platforms compare mathematically. Please see below the same example with different amounts, same examples with a sell price of $0.507 with a corresponding bid of $0.498.
Setup:
- Buy SEI Using DEX swap at an approximate price of $0.498
- Sell SEI Using CEX with an approximate price of $0.507 — create approximately (1.8%) between the two trade
Position is $5,000 with USDC for pricing purposes.
For DEX account: One (1) Approval on SEI Smart Contract, One (1) Swap on SEI Smart Contract. Gas estimates will be reviewed for 2 cases. Fees for exchanging funds to CEX from DEX: CEX will charge a 0.10% taker fee to exchange USDC to USDT; the price impact incurred by CEX is based on a $5k swap; CEX quotes out a 0.30% price impact on the DEX liquidity pool. As well, if you convert USDC into USDT before executing the order, there will be a 0.05% conversion fee.
Transit times to transfer your SEI funds across blockchain to your CEX will take about 5 minutes; expect a 0.20% price fluctuation.
| Cost item | Calculation | Low-Gas L2 | High-Gas Mainnet |
|---|---|---|---|
| Gross spread value | $5,000 × (1.8%) | +$90.00 | +$90.00 |
| DEX Price Impact | $5,000 × (0.30%) | −$15.00 | −$15.00 |
| Gas Fees (Approval + Swap) | Vary by Network | −$0.40 | −$32.00 |
| CEX Taker Fees (Sell) | ~($5,010 × 0.10%) | −$5.09 | −$5.09 |
| Price Impact from CEX (Slippage) | 0.20% | −$10.18 | −$10.18 |
| USDC to USDT Cost | $5,000 × 0.05% | −$2.50 | −$2.50 |
| Transfer Risk Buffer | $5,000 × 0.20% | −$10.00 | −$10.00 |
| NET Profits | ≈ $46.83 | ≈ $15.23 | |
| NET Margin | ≈ 0.94% | ≈ 0.30% |
Notice that both trades have the same amount of gross profit from the same asset with the same distance from the bottom price at the same time but have a difference in the fees if gas prices differ by Network. On a L2, your net profit per trade will be 0.94%; on a congested L1, your net profit will be reduced to approximately 0.30%. Hence, while both cases display a significant spread difference (1.8%), it tells us very little about the cost of trading.
The Pre-Trade Costs Checklist
These five items must be verified before you execute a trade:
- Fees for both Buys and Sells including Maker vs Taker and based on Real Volume.
- Actual Prices where your execution will occur (ask/bid) by Market Level where real values exist.
- Slippage depending on the size of your position will depend on the Depth of CEX Market.
- Costs to Withdraw Between CEX Accounts are Flat Rates.
- Gas Costs For Both Approvals and SWAPs will depend on the Specific Block Chain and Network at Time of Execution.
- Transfer time and drift risk indicate how long you will need to stay airborne and how unpredictable your asset will be within that timeframe for trading in an exchange.
- Funding for perpetual instruments or futures contracts is essential. Cross-examination of which way the funding rate trends will help navigate the two venues doing the trading.
- Stablecoin conversion — Stablecoins from different exchanges may vary when being converted back into USD. Make sure to double-check for price discrepancies before converting.
- Capital deployed — The capital utilized may need to be parsed out in relation to all the capital you locked up, including pre-funding, before you can arrive at a net profit per unit of account.
- Minimum viable spread — will be unique to each trader based on their transaction costs, trade size and length of holding time. The logical conclusion is that if you are operating below your minimum viable spread, your transaction is an expense instead of an investment.
Why Tooling Matters
The ArbitrageScanner is designed with a net-first workflow in mind:
- A futures spread calculator to determine the total cost before spending any money by taking into account fees/financing/split and getting an accurate number.
- A CEX/DEX/futures/funding screener allowing for 80+ CEXs, 25+ DEXs, and 40+ different chains updating every second; each updated with a historical spread (back test) to see which spreads have historically survived the cost of doing business.
- A plan structure allowing an individual to have coverage and tiered access; also allows for a testing plan (managing paper trades) so that an individual can verify against actual real-world market conditions.
The bot can be fully manually operated, so there’s no risk of anyone else accessing your exchange accounts via API, and your funds remain entirely under your own control.
FAQ
Why is my actual arbitrage profit less than the spread I saw in the screener?
A spread is simply a gross, mid-price number — the true amount you can realistically have after accounting for fees associated with each side of the trade plus slippage from the bid/ask that you cross, along with any withdrawal costs or costs associated with gas/transfer fees, along with costs for converting to stablecoins and costs for financing any perps leg of the trade, plus costs associated with the change in value from the time the funds left your account until the time the funds arrive in your account. You can quickly see that these factors plus any transient volatility can easily cut a headline spread in half or more.
What is the minimum spread that can still make money?
That depends on the cost of executing the trade for your size of trading ($ size x transaction fees) and the specific blockchain you are utilizing. For instance, someone with a low-cost per transaction on an inexpensive Layer 2 solution will have a greater spread for breaking even than someone who pays flat fees for withdrawing funds or has the same transaction fee on an expensive Layer 1 solution for the same amount of money.
What types of costs will have the greatest impact on small size trades?
Flat fees only; withdrawal fees and gas costs. A $1 withdrawal and $20 of gas when withdrawing $20,000 is a rounding error; however, it would be a killer for a profit on a $300 withdrawal. Flat fees inversely scale with size. Therefore to appropriately size positions arbitraging will yield a suitable reward.
Does CEX to CEX or CEX to DEX provide a cheaper transaction cost?
It completely depends on the chain and the venue. If executing a CEX to CEX swap, the gas fee will be swapped out for the flat withdrawal fee. If executing a CEX to DEX swap, the transaction fee we will pay in gas will be swapped out for an amount of gas required for that swap and the pool price impact when swapping. For instance, on a cheap L2 (Layer 2), the total cost of executing a CEX to DEX swap may be less than executing the CEX to CEX swap. On the other hand, on a congested mainnet, the transaction cost will most likely be higher; therefore, the gas cost will take precedence. Therefore, it is essential we evaluate both options for each trade we do.
How do you account for risk when transferring your funds?
You assume the transfer time will result in an expected-value haircut. In other words, you estimate how long your funds will be in transit and how much that asset would typically move against you during that timeframe and deduct that from your total cash inflow calculation. Thus, you will have reduced your risk by using faster transfer chains and pre-funding both sides of a transfer.
Does the Spread Calculator guarantee you will make a profit?
The short answer is no; however, it will provide a more realistic net expected value figure. This will prevent you from making trading decisions based upon misleading headline numbers. Execution timing, slippage in real time, and price drift will still introduce variance to the actual figure and no amount of estimates performed with a calculator will eliminate those variances.
Try ArbitrageScanner free for one day and use the full crypto arbitrage toolkit to help you generate profits. The toolkit includes the Spread Calculator to help you understand and accurately calculate the net spread associated with your trades.
This article is for Educational purposes only and does not provide any financial, investment, or tax advice. Arbitraging the cryptocurrencies is speculative; you risk losing all of your capital and the results provided in this article are illustrative only to show how arbitrage works; they do not represent current quotes from any venue, nor do they represent recommendations or guarantees of profits. All fee, spread and gas prices change constantly. ArbitrageScanner is a manual tool with no access to your accounts via API; therefore, you remain in control of your funds at all times. Always confirm all current prices and costs with your trading venue before deploying capital.
Want to learn more about crypto arbitrage?
Get a subscription and access the best tool on the market for arbitrage on Spot, Futures, CEX, and DEX exchanges.

You might be interested
Delisting Risk in Crypto Arbitrage: How to Spot a Coin About to Be Removed Before You Get Stuck
Negative Funding Rates Explained: How to Get Paid to Hold a Delta-Neutral Position
Reading Whale Wallets Before a Token Unlock: An On-Chain Pre-Unlock Checklist
