MACD Trading Strategy: Complete Crypto Guide


with ArbitrageScanner!
The cryptocurrency market can be thought of as a volatile rollercoaster, but the use of technical indicators allows traders to take some of the uncertainty out of daily trades by filtering out noise and identifying the most probable setups. One of the most versatile and highly used indicators in this world is the Moving Average Convergence Divergence (MACD), which is used to identify trend direction and momentum strength. In this article, we will discuss how to use the MACD indicator to build profitable trading strategies.
Understanding MACD
Basic components
The MACD is a popular trend-following momentum indicator that was created by Gerald Appel in the late-1970s and has been used by traders in all markets since its creation — including the highly volatile crypto market. The MACD indicator measures the relationship between two various moving averages of an asset’s price. Its primary function is to identify both trend direction and momentum strength.
The MACD indicator is comprised of three primary components that are depicted on a chart below price action:
- MACD Line: This is the fast-moving line that changes in price quickly.
- Signal Line: This is the slow-moving line that is used as a base for crossover detection.
- Histogram: The histogram displays the distance between the MACD and the Signal Lines graphically.
Technical aspects
The technical aspect of the MACD differs from the way simple moving averages (SMA). The MACD is one of the most adaptable trend indicators available for identifying sudden market shifts. Some ways that this is possible are as follows.
Calculation methods
First, let's begin with the original "12, 26, 9" MACD calculation method. Understanding the way the MACD uses calculation assists in understanding how it is perceived. The MACD line is derived from the following calculation utilising two methods: The MACD line is equal to the 12 period (short-term) exponential moving average (EMA) less the 26 period (long-term) EMA. The signal line is the 9 EMA of the MACD line and has historically provided traders with information regarding entry points based on the MACD histogram.
MACD Elements
MACD line
(MACD Line): This line represents the MACD line and typically appears as a blue line. When the MACD line is above zero (0), it implies that the short-term EMA is above the long-term EMA, thus suggesting a bullish price momentum. Conversely, when the MACD histogram is below zero, it suggests that the MACD line is below its respective. MACD smoothes out price action, thereby limiting its volatility.
Signal line
For cryptocurrency traders, the crossovers of the MACD lines with their corresponding signal line are the primary means of determining when to enter and exit a trade.
Histogram
The MACD Histogram is a graph that shows the difference between the MACD Line and the Signal Line, and its value oscillates above and below the zero line. When the MACD Line is above the Signal Line, the Histogram has a positive value. When the MACD Line is below the Signal Line, the Histogram has a negative value. The height of the Histogram bars reflects the distance between the MACD Line and the Signal Line.
Zero line
The Zero Line is the "zero point" of the MACD, and any time the MACD Line crosses above or below the Zero Line, it is confirmation of a trend that is either bullish or bearish. Traders look to Zero Cross overs of the MACD to determine whether the market is bullish or bearish for a longer period of time.
Signal Analysis
Crossovers
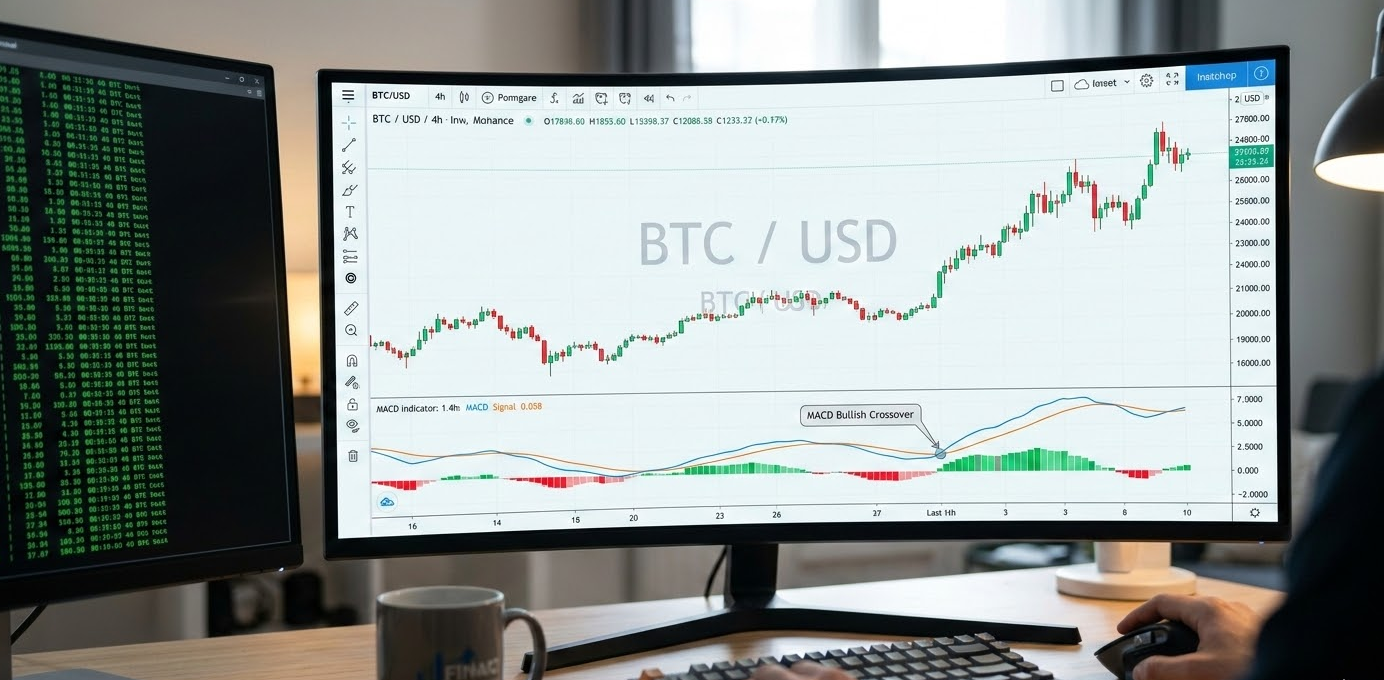
The MACD is used to analyze price movement through an understanding of market psychology when determining when trends occur. The MACD determines trend by analyzing buying and selling signals within the market. A crossover of the MACD and Signal Line serves as the basis for starting a position. A bullish crossover of the MACD Line crossing above the Signal Line is generally interpreted as a buy signal. Conversely, a bearish crossover of the MACD Line crossing below the Signal Line is generally viewed as a sell signal.
Divergences
MACD divergence serves as one of the most reliable indicators in technical analysis. A bullish divergence occurs when an asset's price chart has formed a lower low, while the MACD chart for that same asset is showing a higher low. A bearish divergence appears when the price creates a new High, however, the MACD creates a new Low, signalling an impending reversal of trend.
Trend confirmation
Many traders will wait until the MACD line has crossed the Zero line after a crossover of the signal line before developing a trading plan. This will help reduce "noise" and confirm that the trading plan is in alignment with the actual momentum of the market.
Signal interpretation
The MACD shows more than simply "buy" or "sell". The rate of convergence of the MACD line to the signal line will help you to determine the rate of acceleration/deceleration of any given trend. Therefore, traders will often use the MACD indicator to determine the magnitude of price movement prior to committing their capital.
Trading Strategies
Entry points
A properly designed crypto trading strategy is a combination of the following: Structure, Discipline. High-probability entry points usually occur when there is a Bullish MACD signal line crossover while the MACD line is below the Zero line (indicating that this security/asset is "oversold"). When there is a Bullish MACD signal crossover below the Zero line, it suggests that there is a potential for momentum to begin from a low value.
Exit signals
It is essential for the protection of profits to determine the proper exit signals. Many crypto traders will look to the fading of the MACD histogram as an indication of scaling out of their positions before a full bearish crossover occurs.
Risk management
No indicator is 100% accurate in crypto. Always place stop-loss orders. A common rule of thumb is to place a stop-loss order immediately below the most recent swing low price when entering on an MACD signal.
False signals
The MACD is able to produce "whipsaw" trades such as those found in a sideways market. One of the most popular methods among traders to reduce false MACD signals is to only enter trades that follow the trend on a higher timeframe (i.e. Similarly, you would only enter a buy on a one-hour chart if the trend on the 4-hour chart was up).
Comparison Analysis
MACD vs RSI
How does MACD perform relative to other indicators and what can it improve on? The main difference between MACD and RSI is that MACD measures momentum based on moving averages, whereas RSI measures speed of price changes. MACD is classified as a momentum indicator while RSI is considered an overbought/oversold indicator.
Combined strategies
Using a combined approach produces the most accurate trades. For example, leveraging MACD convergence/divergence with RSI or Bollinger Bands will increase win rates by providing validation to the signal from different data points.
Indicator limitations
MACD is a lagging indicator; signals will tend to produce after the price has already moved in conjunction with the MACD's lines, thus you may miss the very first portion of a move. Therefore, combining the MACD with price action becomes critical to successful trades.
Best practices
The majority of traders use the "default" MACD settings of 12, 26, 9 as their default MACD settings across all assets. However, many cryptocurrency traders prefer a faster setting to account for the higher volatility of cryptocurrency. Always backtest any MACD trading strategy before entering the market.
Practical Application
Trading setup
Real World Example: Are you ready to put this into your own plan? Here's how it works. Set up for trading: When you are using your charting software, you want to see the MACD line plotted with the signal line. The 9-period EMA of the MACD is clearly visible as this will be used to trigger most of your trades.
Signal confirmation
Wait for the MACD lines to cross over to be confirmed on a closed candle and make sure the trading volume is increasing when there is a bullish crossover.
Strategy implementation
Implementing the strategy: When the MACD line crosses with the signal line, take a look at the MACD histogram and if the histogram is expanding, this indicates that the MACD has made a large move. Now is the time to place your buy or sell limit order.
Risk control
Controlling risk: Although MACD shows traders trend direction, it cannot account for certain events known as "Black Swan" events. Due to this, it is always advisable that crypto traders utilize an additional form of analysis in addition to MACD signals and strict risk management.
Conclusion
The MACD is a key tool that is necessary for anyone who is involved in crypto trading. Knowing the difference between the MACD line and the signal line, along with understanding the histogram and how it measures momentum, will allow you to make wiser decisions as you trade throughout the different market cycles. Whether you are looking for a bullish MACD entry or bearish exit, the use of the MACD gives you a clear, data-driven means to obtain success in the crypto market.
FAQs
Is MACD reliable for crypto trading?
Absolutely! MACD is a very reliable method to determine trend direction and identify momentum, especially on 4-hour and daily time frames, when market noise is at its lowest point.
What's the best MACD strategy for day trading?
The best strategy for a day trader is the "Zero-Cross" strategy and volume analysis. When the MACD crosses the zero line and moves in the same direction as the current daily trend, it is now time to enter your trade.
How to avoid false MACD signals?
The best way to avoid false MACD signals is by not trading the MACD when the price is moving sideways (range bound). To confirm the trend direction, use an additional indicator, such as the RSI or 200-period Simple Moving Average (SMA).
Can MACD predict price movements?
The MACD is largely a lagging indicator, however, there are instances when MACD divergence will provide advance warning to traders of an upcoming potential price reversal.
How to combine MACD with other indicators?
The MACD code should be combined with the RSI indicator for overbought/ momentum and the Exponential Moving Average (EMA) indicator for trend direction, thus creating a solid "confluence" based trading strategy.
Want to learn more about crypto arbitrage?
Get a subscription and access the best tool on the market for arbitrage on Spot, Futures, CEX, and DEX exchanges.

You might be interested

Cryptocurrency Nodes and Masternodes: Complete Guide

Cryptocurrency Decentralization: Complete Guide

Understanding Fiat and Cryptocurrency: A Complete Guide
