Wallet Intelligence in 2026: Tracking Smart Money With 272 Criteria


with ArbitrageScanner!
All on-chain wallets are publicly available, but you have to see them in order to look at them. Each of the 272 wallet scoring criteria help determine where the action is taking place by utilizing raw blockchain data to identify trends and generate signals for when someone will act.
For example, in June 2026, the 272 criteria allowed for the identification of pre-listing accumulation on BEAT (listing) before the Bitget announcement 48 hours beforehand, highlighted the HOME funding spike via unusually high short positions, and exhibited the exit of smart money prior to the distribution phase of 6 mid-cap altcoins (within 24 hours of distribution).
In this article, I will give you a breakdown of what each of the 272 criteria measures, how to implement your findings, and some of the repeat patterns that can be viewed before any successful signal generation occurs.
What Is Measured by Wallet Intelligence?
The most basic way of tracking a wallet is to find a "whale" and copy the trade; with whales losing money, faking signals, and spreading multiple trades across multiple wallets, it is only successful every 20 attempts.
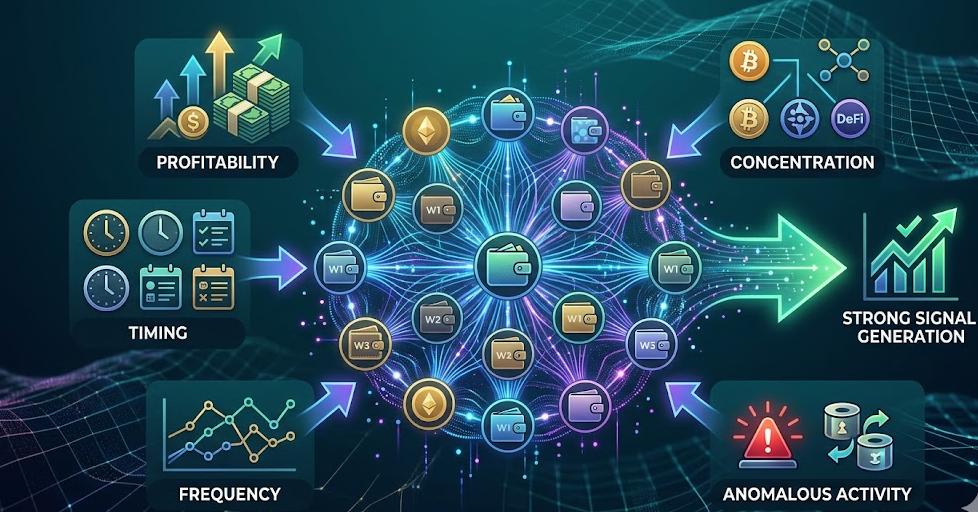
Utilizing a 272-criteria analysis, a wallet is considered to be a behavioral profile, and criteria can be grouped into approximately 7 different types.
Profitability metrics (approximately 35 criteria) consist of the realized PnL per token, win rate, average holding period, and Sharpe ratio of investment return when measured against an index of the overall market. The profitability metrics also include the drawdown of the wallet.
Trade timing signatures (approximately 45 criteria) consist of the time lag between when the wallet enters a position and when an event (i.e. listing) occurs. Wallets that consistently enter before an event get a high score, whereas those that frequently enter after an event receive a low score.
Wallet interaction frequency (approximately 40 metrics). Is this wallet's interaction occurring with the same cluster of wallets, which follow a pattern? If these wallets are consistently transacting with one another, they may belong to a coordinated entity. Wallets that are designated as cluster leaders will get tagged in a different manner than wallets that are clustered with them by their interactions.
Token concentration (approximately 30 metrics). Does this wallet demonstrate an affinity for memecoins, blue-chip tokens, DeFi tokens, and AI gaming? If the majority of a wallet's holdings are in a particular sector, and it has a history of being profitable within that sector, they can be classified as a sector specialist. This is important when the price of that sector appreciates.
Liquidity provision (approximately 25 metrics). Does this wallet provide liquidity to CEXs or to decentralized exchanges before they erupt in price? How does this wallet's liquidity-related activity compare with similar types of activities in other tokens? The patterns of liquidity provision often identify emerging trends in the underlying asset.
The day and time coins are traded (approximately 20 metrics). If a distinct and predictable pattern may be seen in a wallet's trades, that would indicate the use of an automated trading platform or an operator's specific trading period. If a wallet's trade activity indicates an inconsistent pattern over time, it may suggest there is a person behind the wallet doing discretionary trades. These patterns can both be good indicators, but for disparate purposes.
Anomalous activity (approximately 77 metrics). If a wallet has sudden, unexpected deposits from unknown sources; or has executed an unexpected number of transactions; has made an anomalous method of trading; is linked to an identified exchange wallet; is linked to a mixer wallet; is linked to an identified sanctioned wallet. All of these conditions create potential alerts to investigate further.
The end result of this analysis is the generation of a score for each wallet (overall score) plus one or more tags associated with the wallet. Example tags of a specific wallet may include "highly profitable," "memecoin specialist," "cluster leader," "anomalous activity within past 24 hours." When this combination of scores and tags is identified, it can provide a strong signal to investigate what assets are being purchased.
How this produces pre-event signals
Three repeating patterns produce the bulk of actionable signals. The three most significant patterns for actionable signals are:
Pre-listing accumulation
Prior to a centralized exchange listing a token, there are often market makers and insiders who are accumulating tokens on the decentralized exchange prior to the public announcement of the listing. On the blockchain, the 12-72 hours prior to listing announcements exhibit notable buying activity in that many wallets with high past profitability will all make the same purchase then within a short, tight time period. Each of these wallets could potentially be viewed as normal; however, when they are all buying collectively at the same time, it demonstrates being part of a larger group of wallets, therefore not taking away from their credibility. This is referred to as a cluster signature.
As an example, there were 8 wallets with a high score that purchased BEAT prior to the Bitget listing announcement in late May 2026, and each of the 8 wallets purchased between $50,000 and $400,000 worth of BEAT over approximately 38 hours prior to the announcement. All 8 wallets did not hold any BEAT tokens prior to the listing announcement, and BEAT subsequently experienced a 65% increase within a 24-hour period following the announcement.
Cross-venue funding signal
When an extreme funding event occurs in the marketplace (such as an extreme funding rate of -901 basis points at KuCoin related to HOME), the transaction will usually occur in multiple smaller venues 4-12 hours before the transaction becomes an extreme funding event. As a result, smart-money wallets initially will open their short position at the venue with the highest rate of liquidity. Wallet intelligence that monitors the wallet positions from different collateralized derivatives (perpetuals) can identify the divergence of activity between venues before such divergences occur within the funding rate.
Smart-money exit
The reverse signal also has practical value. Typically, following the 24-48 hour period in which wallets with a strong historical return on investment sell their holdings of a particular token, these tokens tend to reach their peak values. Distribution patterns are noticeably different than random selling; for example, large volume, which is executed across several different venues, typically occurs prior to a liquidity provider removing their liquidity.
Operationalize the Signals
A good wallet intelligence stack is only useful when it generates an actionable output. The workflow consists of several steps:
- Subscribe to a list of high-scoring wallets within your area of interest (i.e., blue chips, DeFi, meme coins, etc.).
- Set alerts for cluster buy events (i.e., when more than three wallets buy a new token within 6 hours). Find a match on a listing calendar & if a token shows a cluster buy signal that's not on any list... that's a signal to take great notice of (as a presale).
- Keep to sizing your positions based on how strong the signal is, as a cluster of 3 wallets is weaker than a cluster of 8 wallets & the concentration of tokens in the wallets matter too (in the example of an 8 wallet cluster if all of them were members of the memecoin community then it's less strong than if all are members of the DeFi community).
- Have sell triggers set up based upon either how or what types of supply are being provided or when you are going to hit a profit target. Don't continue riding your signal until the end of time.
Things that the solution does not address
You need to be aware of what those limitations are:
Wallet Intelligence is only probabilistic, not a done deal. Smart wallets that have built their reputation have been wrong 30-40% of the time. The more clusters you see with one single wallet, means that it's a higher probability that it will happen, not that it will happen.
There will be no exits identified within the signal. Oftentimes, there will have been tokens that were recently bought from those that were already held long before; the buying wallets are too late to have the same opportunity for the same exit level.
You cannot get into any off-chain information from using Wallet Intelligence. The types of events that can generate signals (but are not documented by wallets) like legal actions against companies that provide support for digital tokens or a company that is developing a digital currency will usually be documented in the wallets' behaviour once they have already affected the price.
A company that has the resources to execute its strategy may attempt to move one or more wallets into their own company through a combination of newly opened wallets as well as old wallets. This has yet to happen in practice because of the operational complexity and cost required to do it.
The 272 Criteria Approach VS. the Traditional Whale Watch
Why 272 criteria versus a simple "follow wallets with over 10MM dollars"?
Simply because you can't track down the absolute size of a wallet based on just its balance alone. Cold storage and custodial wallets of large exchanges; their historical data does not reflect rational behavior based on trading volume and price action. Small to mid-sized wallets ($100k-2M) have historically shown themselves to be efficient traders as investment funds based on past returns.
Filtering solely on individual wallet criteria often ignores the dynamics of clusters. Individual criteria alone can miss a single wallet but have the ability to tie this to a larger cluster of wallets (12) with an aggregate value of $50 million. The signal of the cluster is the actionable component for a trader.
In addition to this, utilizing the 272 criteria for scoring allows for slicing across different sectors and styles of trading. Example - memecoin signals should not be viewed in the same manner as yield-based stablecoin trading; therefore, the flat top 100 whale list bunches these signals into noise.
Live Examples From June 2026
Based on the activity through the first week of June 2026, below are live examples from the use of this scanner without naming individual wallets (name of wallet would create a copy-trading target and thereby, the signal would change):
A group of six wallets (based on their score) in memecoin accumulation accumulated 7 million tokens purchased from Pump.fun within 31 hours of the token's CEX listing announcement 41 hours later. After the 7 million tokens were purchased, the token price had increased 4 times in value in the week after they purchased.
A high DeFi whale wallet with a score of 1,780 accumulated $2.8 million into a Solana-side stablecoin protocol 72 hours before the yield boost announcement for this stablecoin. The stablecoin price increased 28% after the accumulation.
A cluster of four wallets began distributing their top 50 token within 48 hours of each other; the token peaked 18 hours after the first wallet distributed it and dropped 22% in the following four days.
While none of these signals are guaranteed, all of them produced profitable trades based on expected value with regard to the cluster signal as opposed to their individual signals.
Uniting Wallet Intelligence along with Others Tools
Combination of wallet signals and multiple analytical sources produces stronger trading signals by providing:
Scanning of funding rates. An individual obtaining a short position on a token is more effective when combined with a rising funding rate; it provides a stronger signal than either alone.
A review of sentiment in social networks such as Telegram and Reddit. Accumulation by wallet intelligence providing sell-side volume will present more evidence of potential for asymmetric returns if sentiment towards an asset is still bearish. Conversely, accumulation attracts smart-money sell-side if sentiment is already euphoric.
Calendar of new token listings. Trading based on wallet intelligence provides optimal performance when an upcoming centralized exchange (CEX) listing occurs within 24 hours.
Spread-scanning of decentralized and centralized exchanges. Signals from wallet intelligence provide insight into increased spread between decentralized and centralized exchanges. Trading on increases to spreads after, but still during peak, is more financially beneficial.
ArbitrageScanner consists of all the tools listed under 1-4 above. The platform incorporates the aforementioned analytical techniques along with the following tools: AI-based wallet analysis based on 272 criteria, sentiment analysis via social networks (TG and Reddit), and new listings calendar scanning.
FAQ
Is wallet intelligence legal to use?
Yes. All on-chain information is public. All on-chain intelligence signals can be accessed through the blockchain, which is also public. Therefore, it is possible that legal questions may arise based upon how signals are used, but not upon creating the analysis. For instance, insider trading laws will normally not apply to the analysis of on-chain intelligence, as on-chain intelligence can be obtained publicly and anonymously.
Can I simply download my own Dune Analytics dashboard and analyze without ArbitrageScanner?
It is possible to create wallet labeling on Dune Analytics; however, the timeframe for labeling all 272 wallet criteria is approximately 2 to 4 months; thus, arbitraging using Dune is less efficient than using ArbitrageScanner due to the processing duration alone. Furthermore, the majority of Dune uses only one chain, while ArbitrageScanner incorporates activity across 40+ chains.
How long will wallet intelligence signal last after discovery?
Cluster buys based on new CEX listings have a discovery time of 24 to 72 hours; distributions will likely provide sufficient lead time of 24 to 48 hours prior to their creation. During this time, anomaly signals will typically remain useful 4 to 6 hours after discovery.
Is this applicable to blue-chip cryptocurrencies such as BTC and ETH?
Decreased operational efficiencies occur when there are millions of participants. Therefore, wallet intelligence signals should provide the highest probability for trades on mid-cap cryptocurrencies (between $50 and $2 million).
Try ArbitrageScanner free for a 1-day trial period; throughout this trial, you will receive analyses based on 272 criteria for determining wallet-based trading signals, access to social media sentiment messages, and access to arbitrage based on token listing and funding across 80+ CEX exchanges and 25+ DEX exchanges.
IMPORTANT! Our company builds software. We will not provide you with any recommendations related to earning potential, nor inform you where you should invest your money. All trading performed on ArbitrageScanner is fully manual; thus, you retain total control over your entire funds at all times as the owner of the account. At certain times in the past, various clients have experienced returns for an arbitrage investment. However, the availability of opportunities for arbitrage will vary by individual and market factors; therefore, you should never expect to receive the same rate of return on your trades.
Want to learn more about crypto arbitrage?
Get a subscription and access the best tool on the market for arbitrage on Spot, Futures, CEX, and DEX exchanges.

You might be interested

Solana MEV in 2026: The Retail Arbitrageur's Survival Guide

Memecoin Listing Arbitrage: The DEX-to-CEX Spread Playbook for June 2026
HYPE Funding Rate Arbitrage: Capturing the Hyperliquid vs Binance Spread in June 2026
